
How the tab works
One report on screen at a time. At the top is which report and for what period, below it the report itself. The app remembers the report and the period: open “Spending trend” for six months, and next time that's what opens.
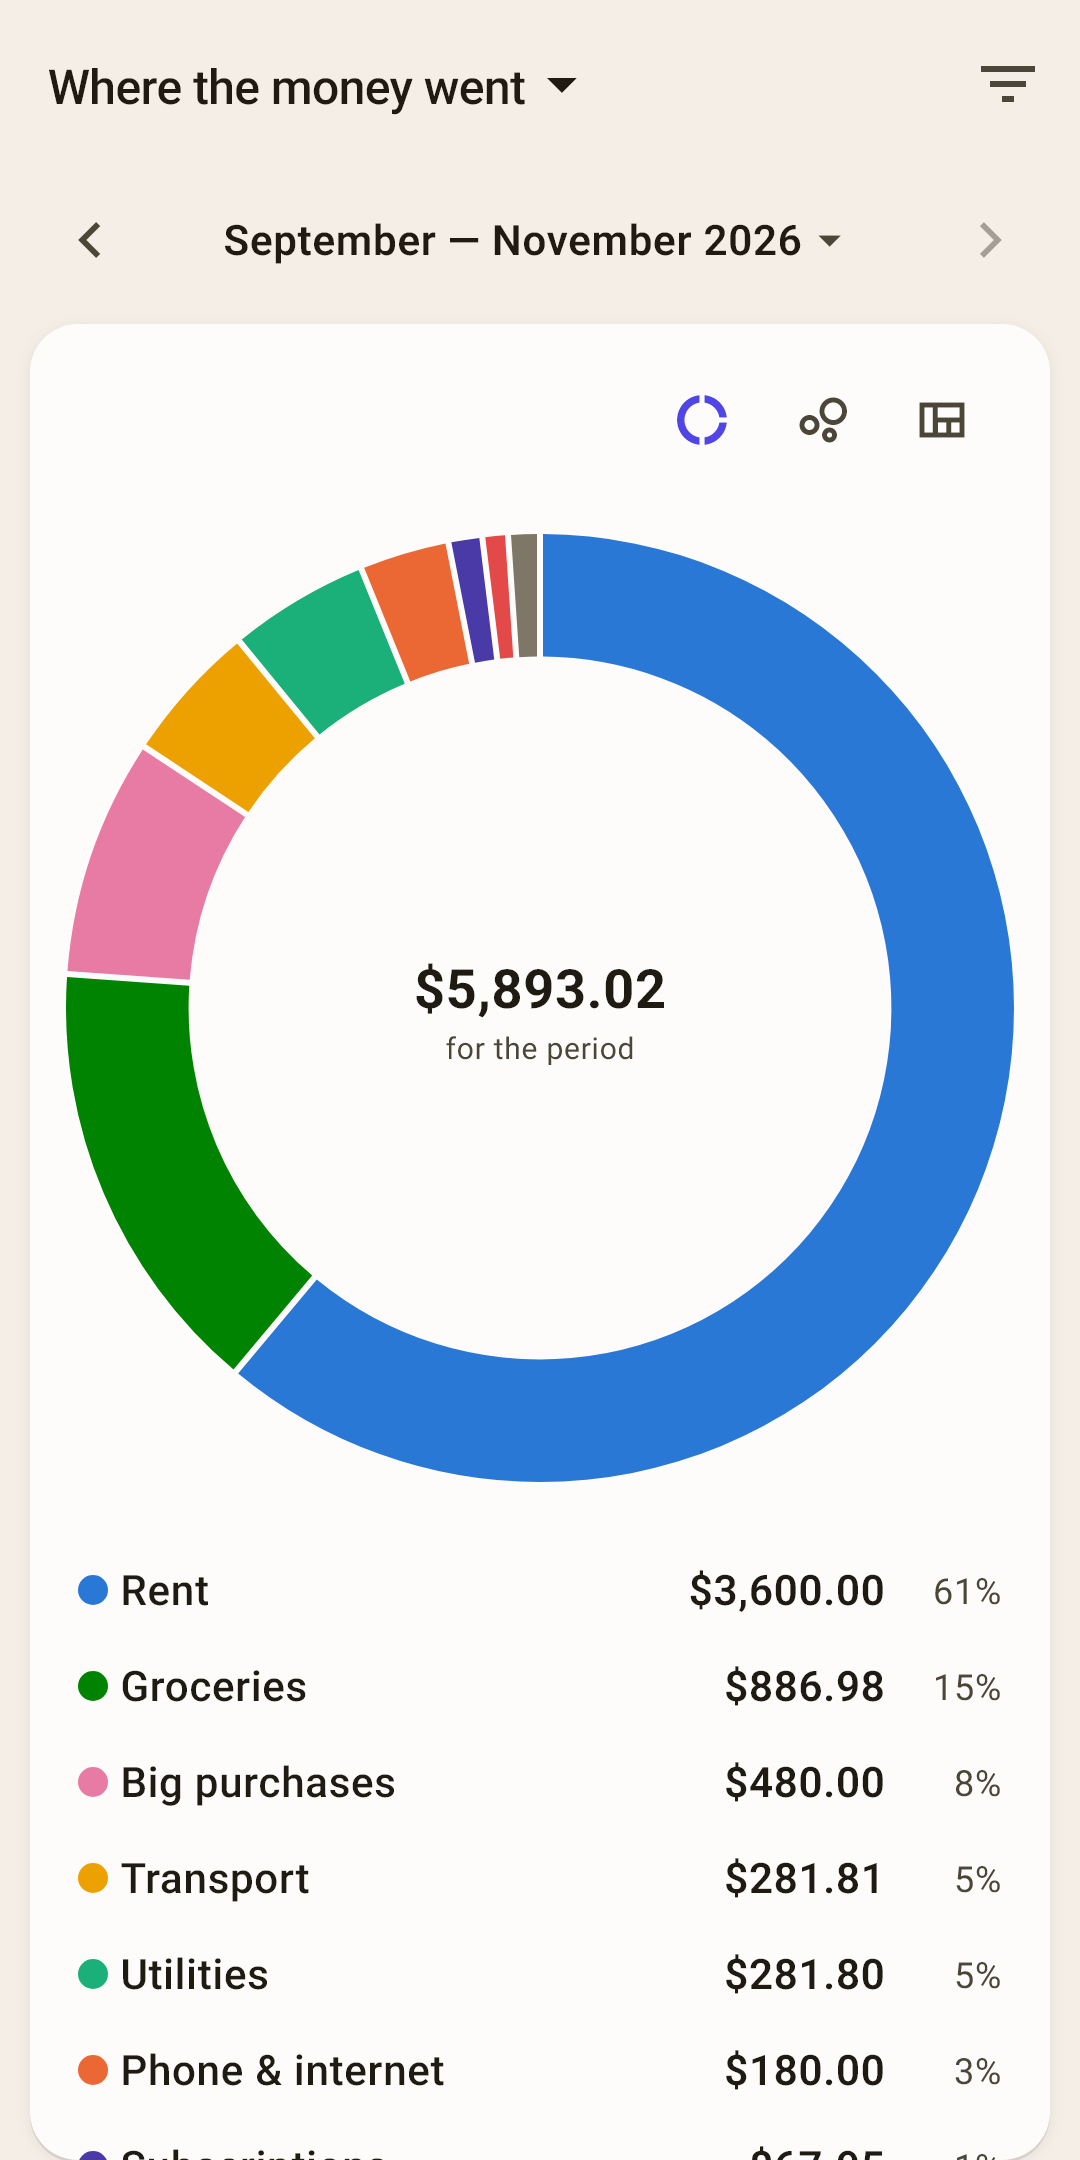
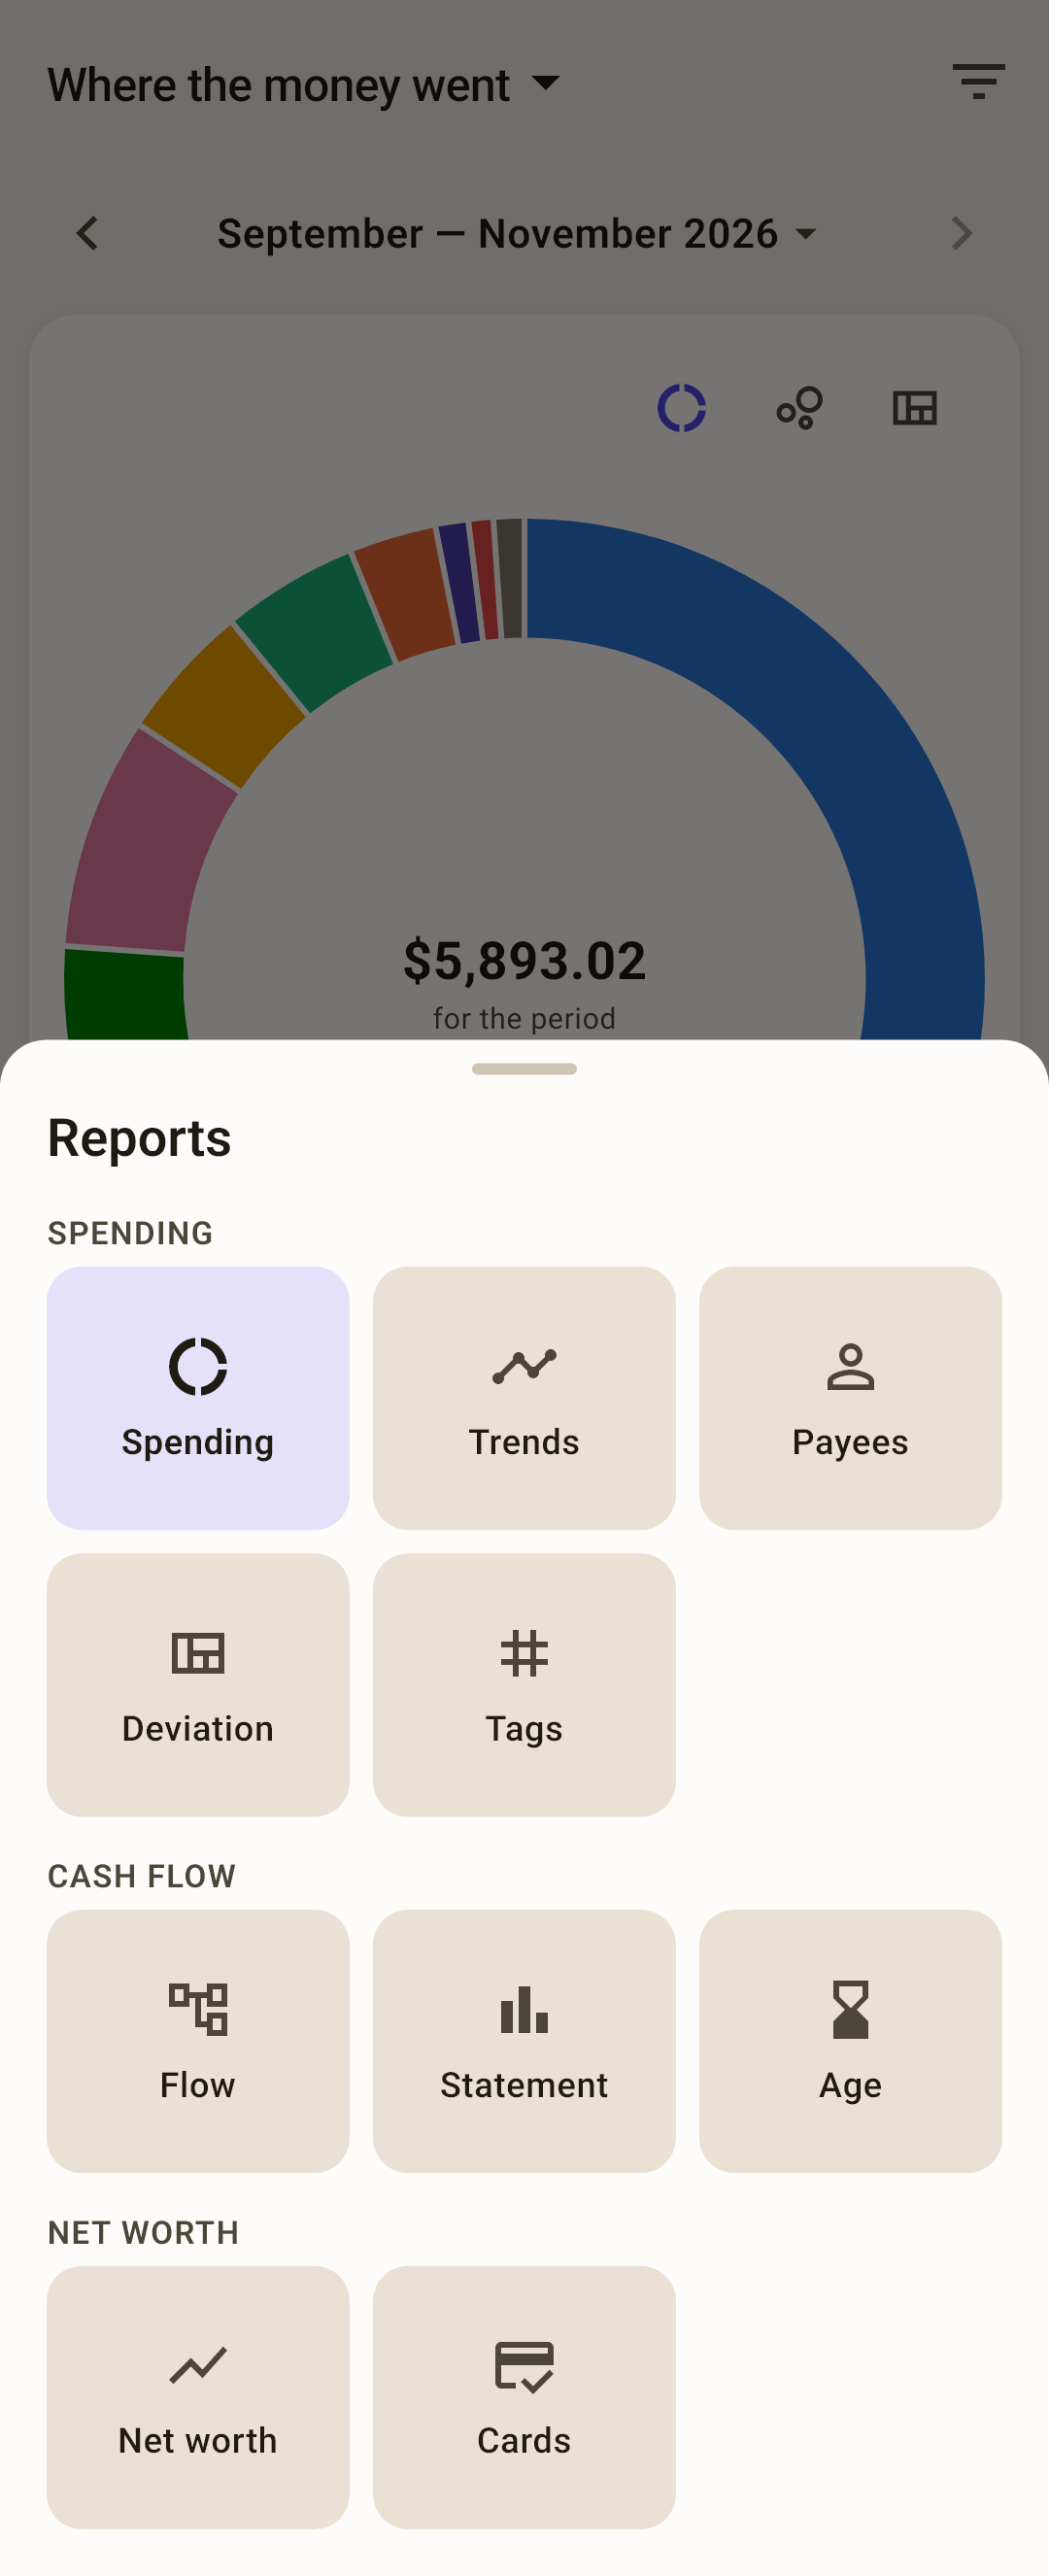
Report name — tap it to open the list of all reports (screenshot below).
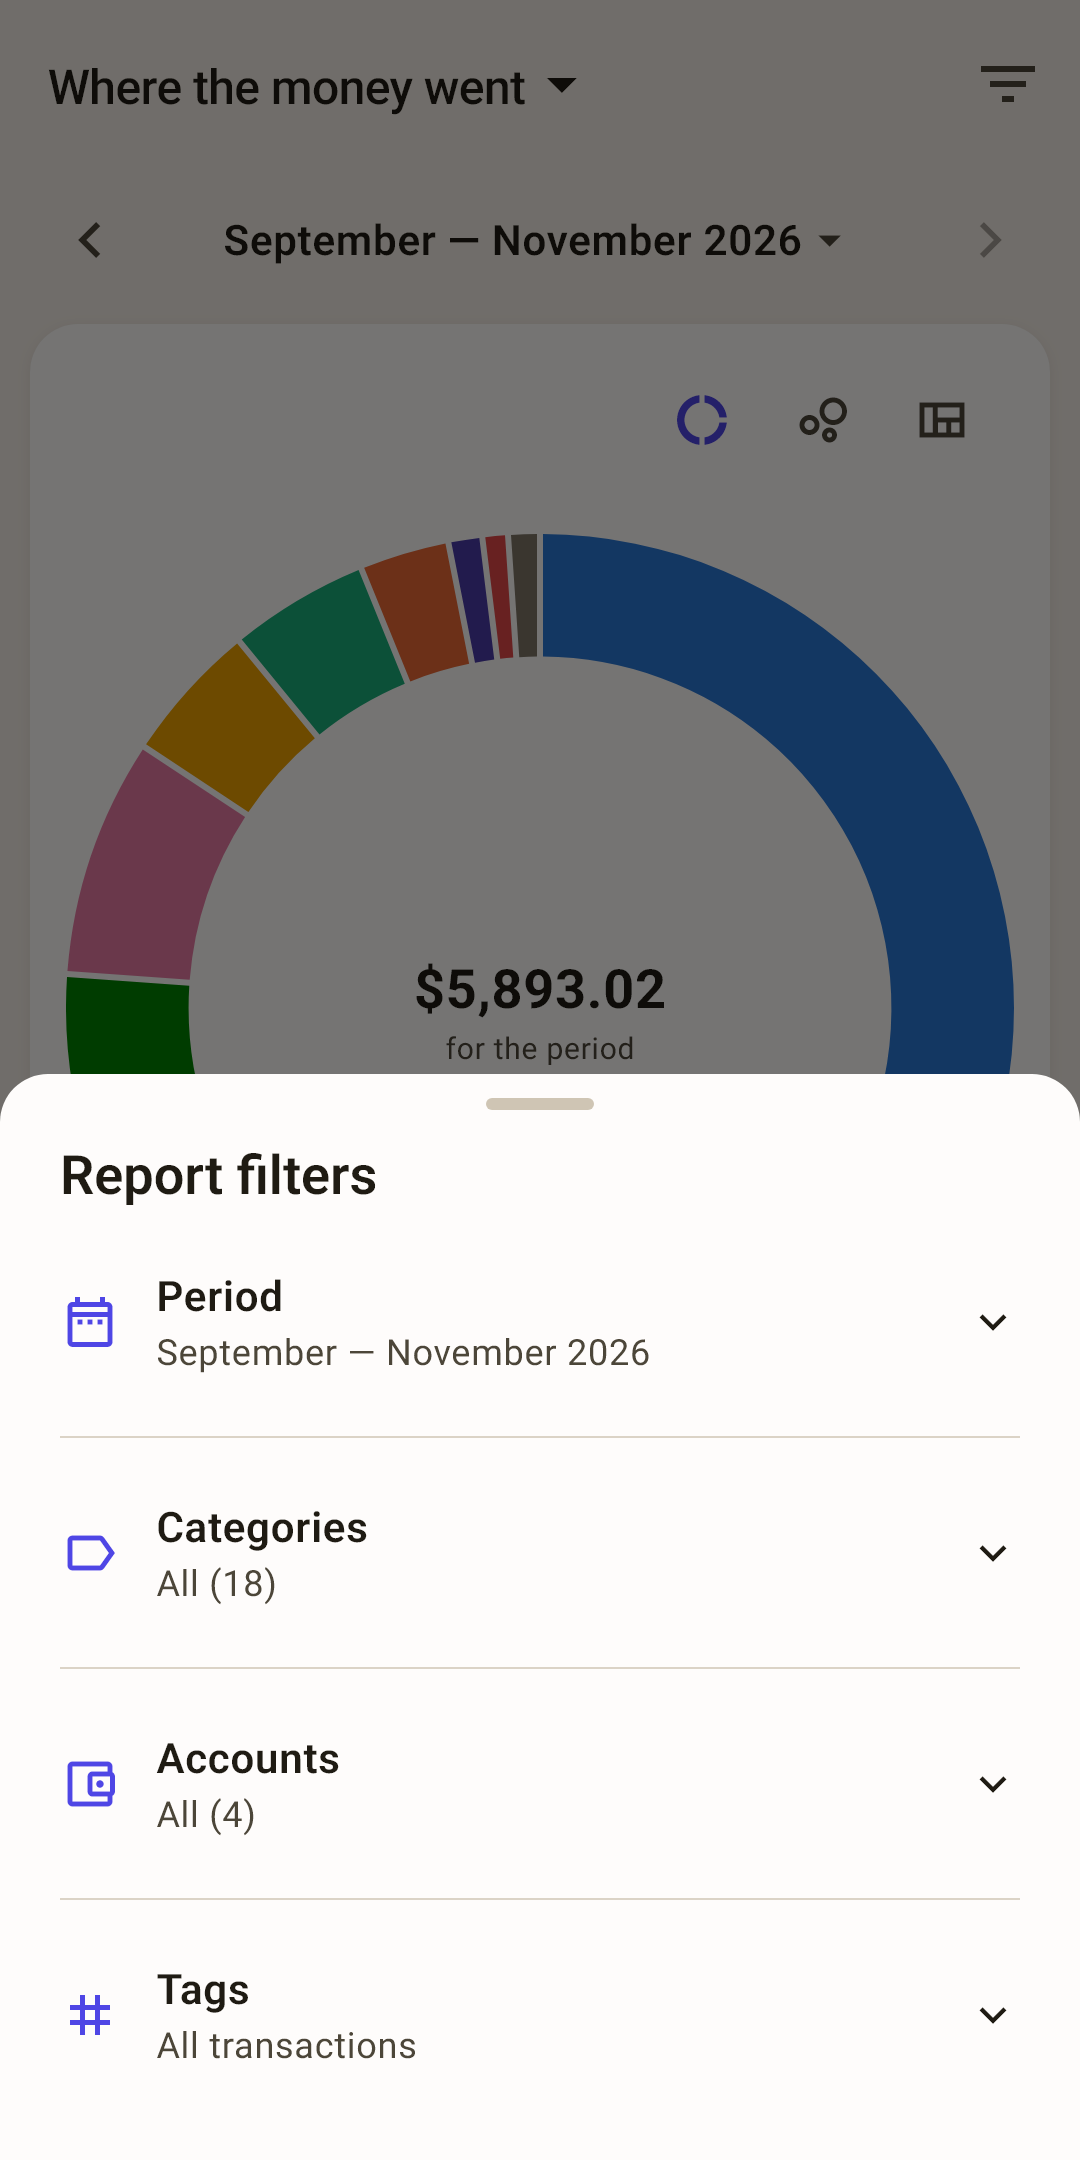
Filters — the funnel: period, categories, accounts, tags. The number on it is how many filters are on.
How it works
Turn off the “Rent” category — it disappears from the spending reports, and your everyday spending picture gets clearer. Filters are remembered for each budget.
Period — the “‹ ›” arrows move the window one month back or forward, and tapping the label opens the period picker: a month, 3, 6, 12 months, year to date, or your own range.
How it works
Moved away from the current month? “Today” appears next to it, to get back. Each report has its own period: spending is handy to view by month, and the trend by year.
View — some reports have several views: donut, bubbles, tiles, table or chart. The choice is remembered for each report.
List — the same numbers as rows: color, name, amount, percent. Tap a row to open the category or payee screen.
 Open the screenshot full size ↗
 Open the screenshot full size ↗
Spending
Where the money goes and how that changes.
Where the money went
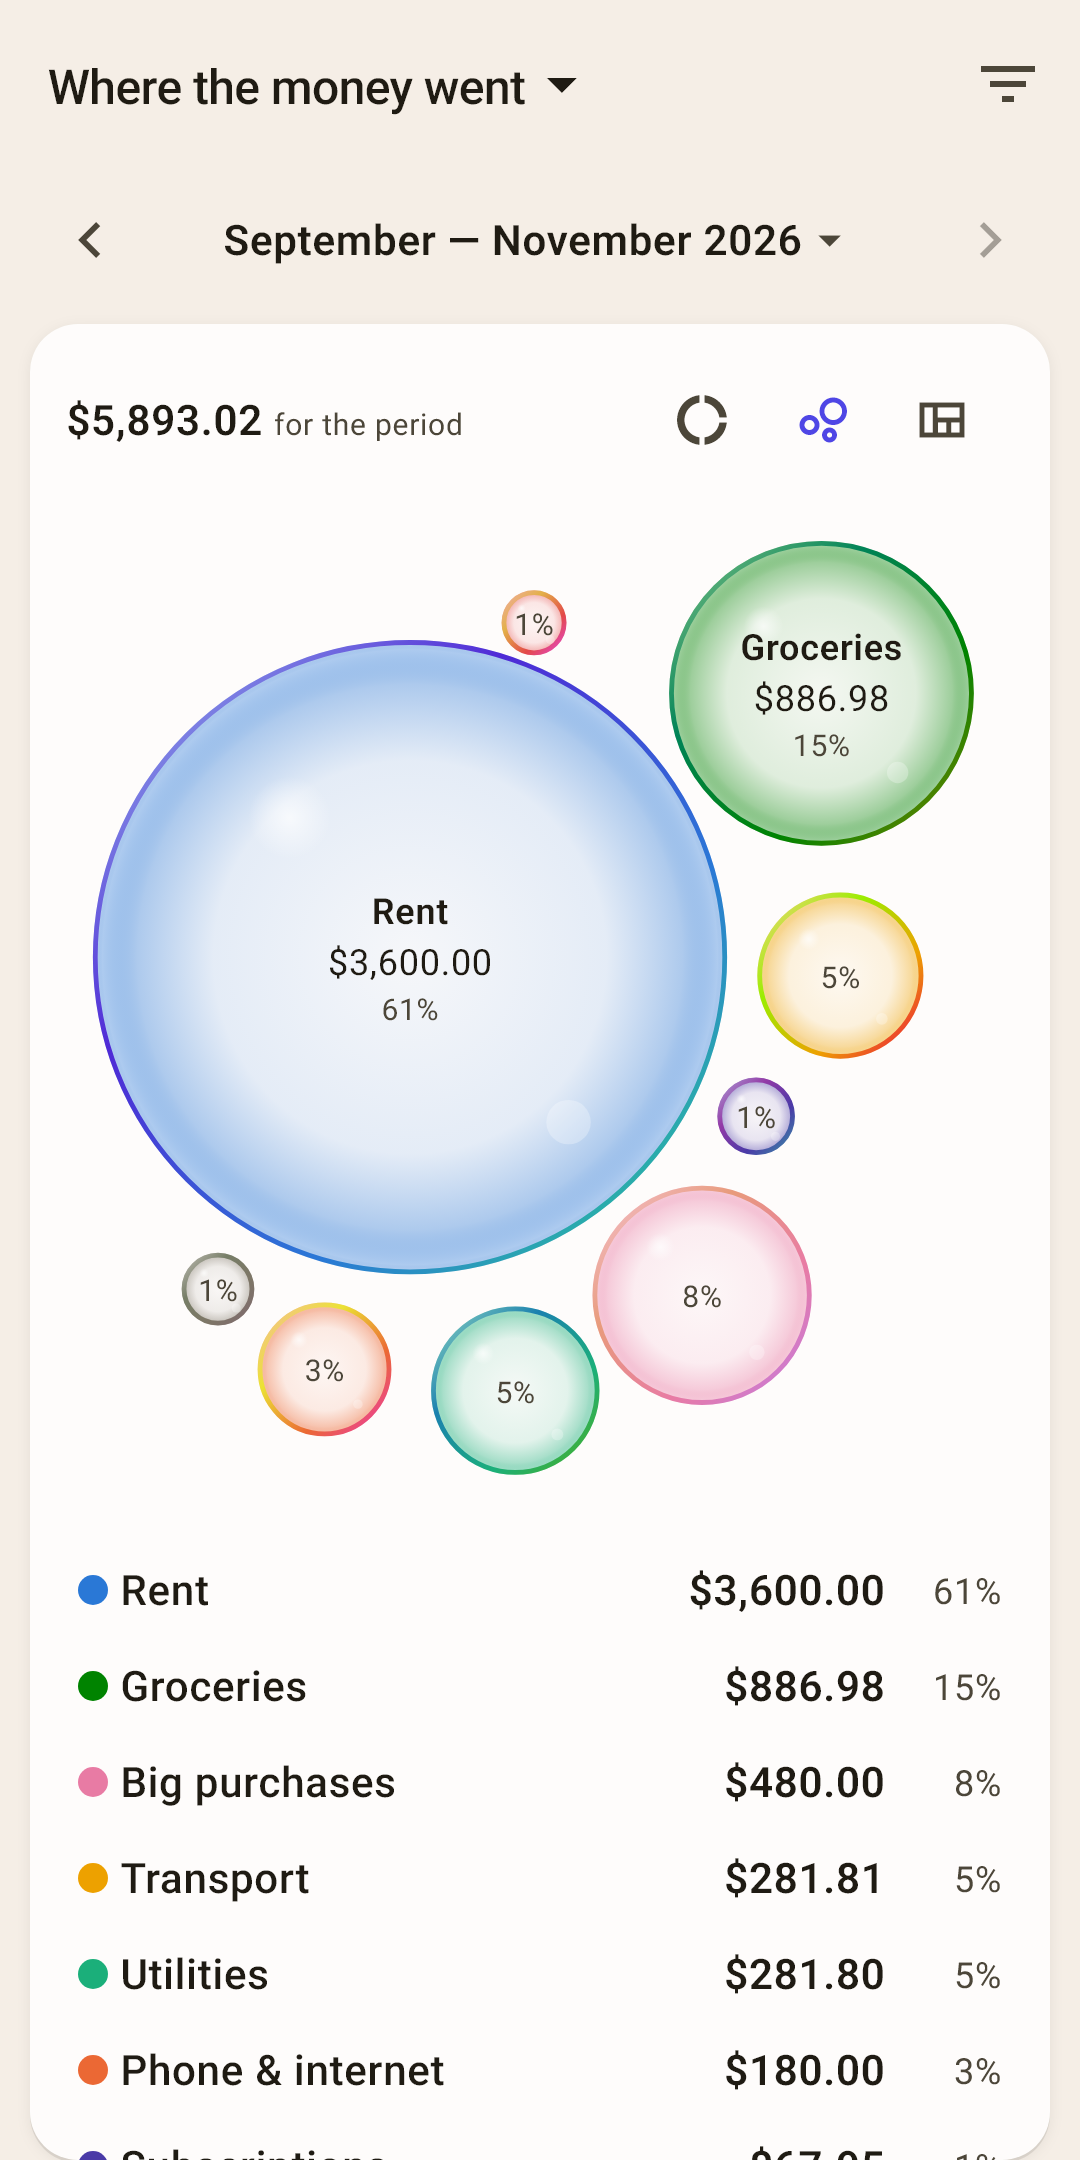
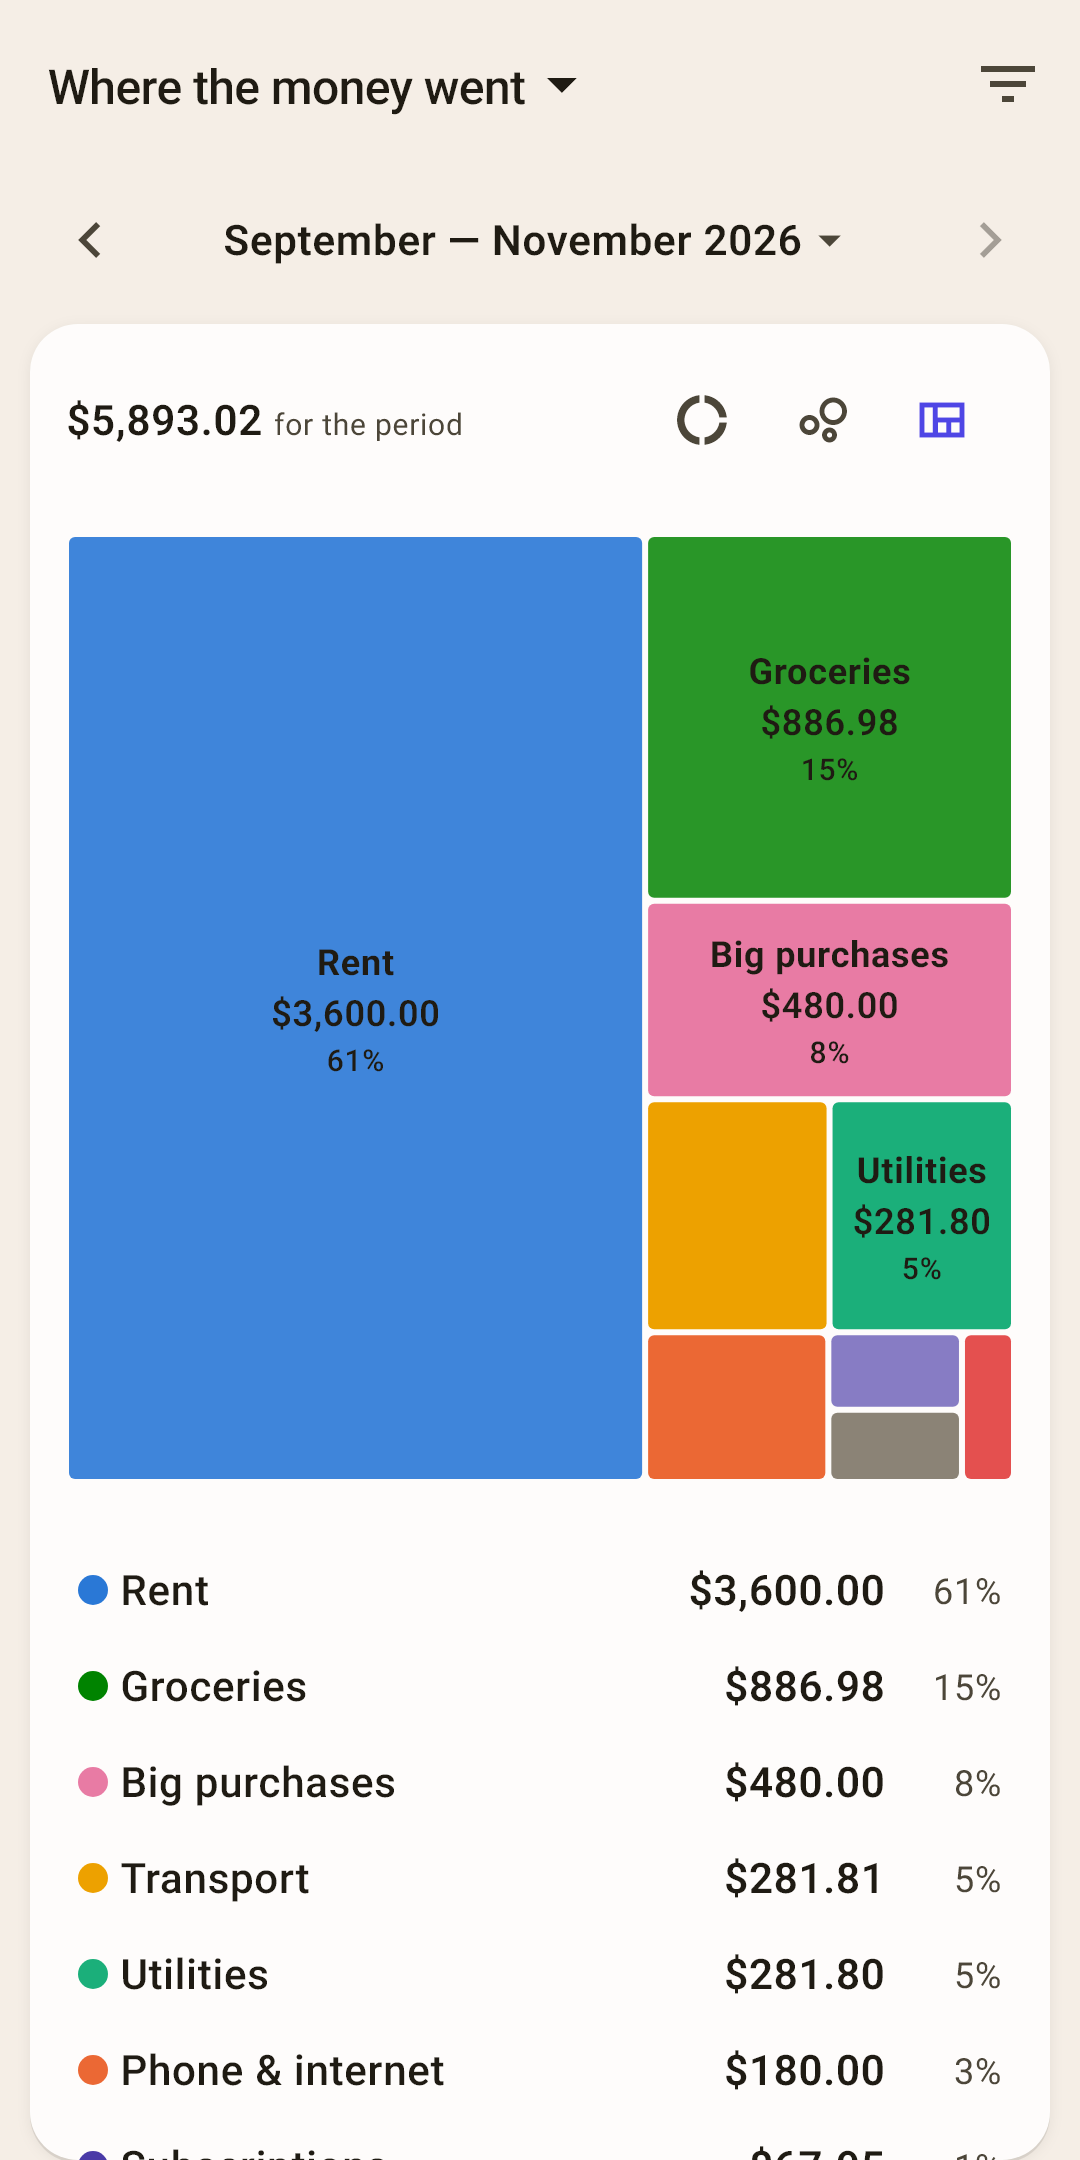
Spending over the period by category — the main “where did it all go” report. Three views of the same thing: pick whichever is clearer to you.
 Open the screenshot full size ↗
 Open the screenshot full size ↗
Donut, bubbles, tiles
Switch between them with the icons on the right above the picture. The donut is familiar; bubbles and tiles show small categories better next to big ones.
Tapping
Tap a slice of the donut, a bubble or a tile — it's highlighted, and its row lights up in the list. A second tap opens that category's screen.
What's counted
Spending minus refunds, without transfers between your own accounts. In the screenshot, $5,893 went out over three months, 61% of it on rent.
How it works
Want to see everyday spending without rent and utilities? Remove them in the “Categories” filter.
Spending trend
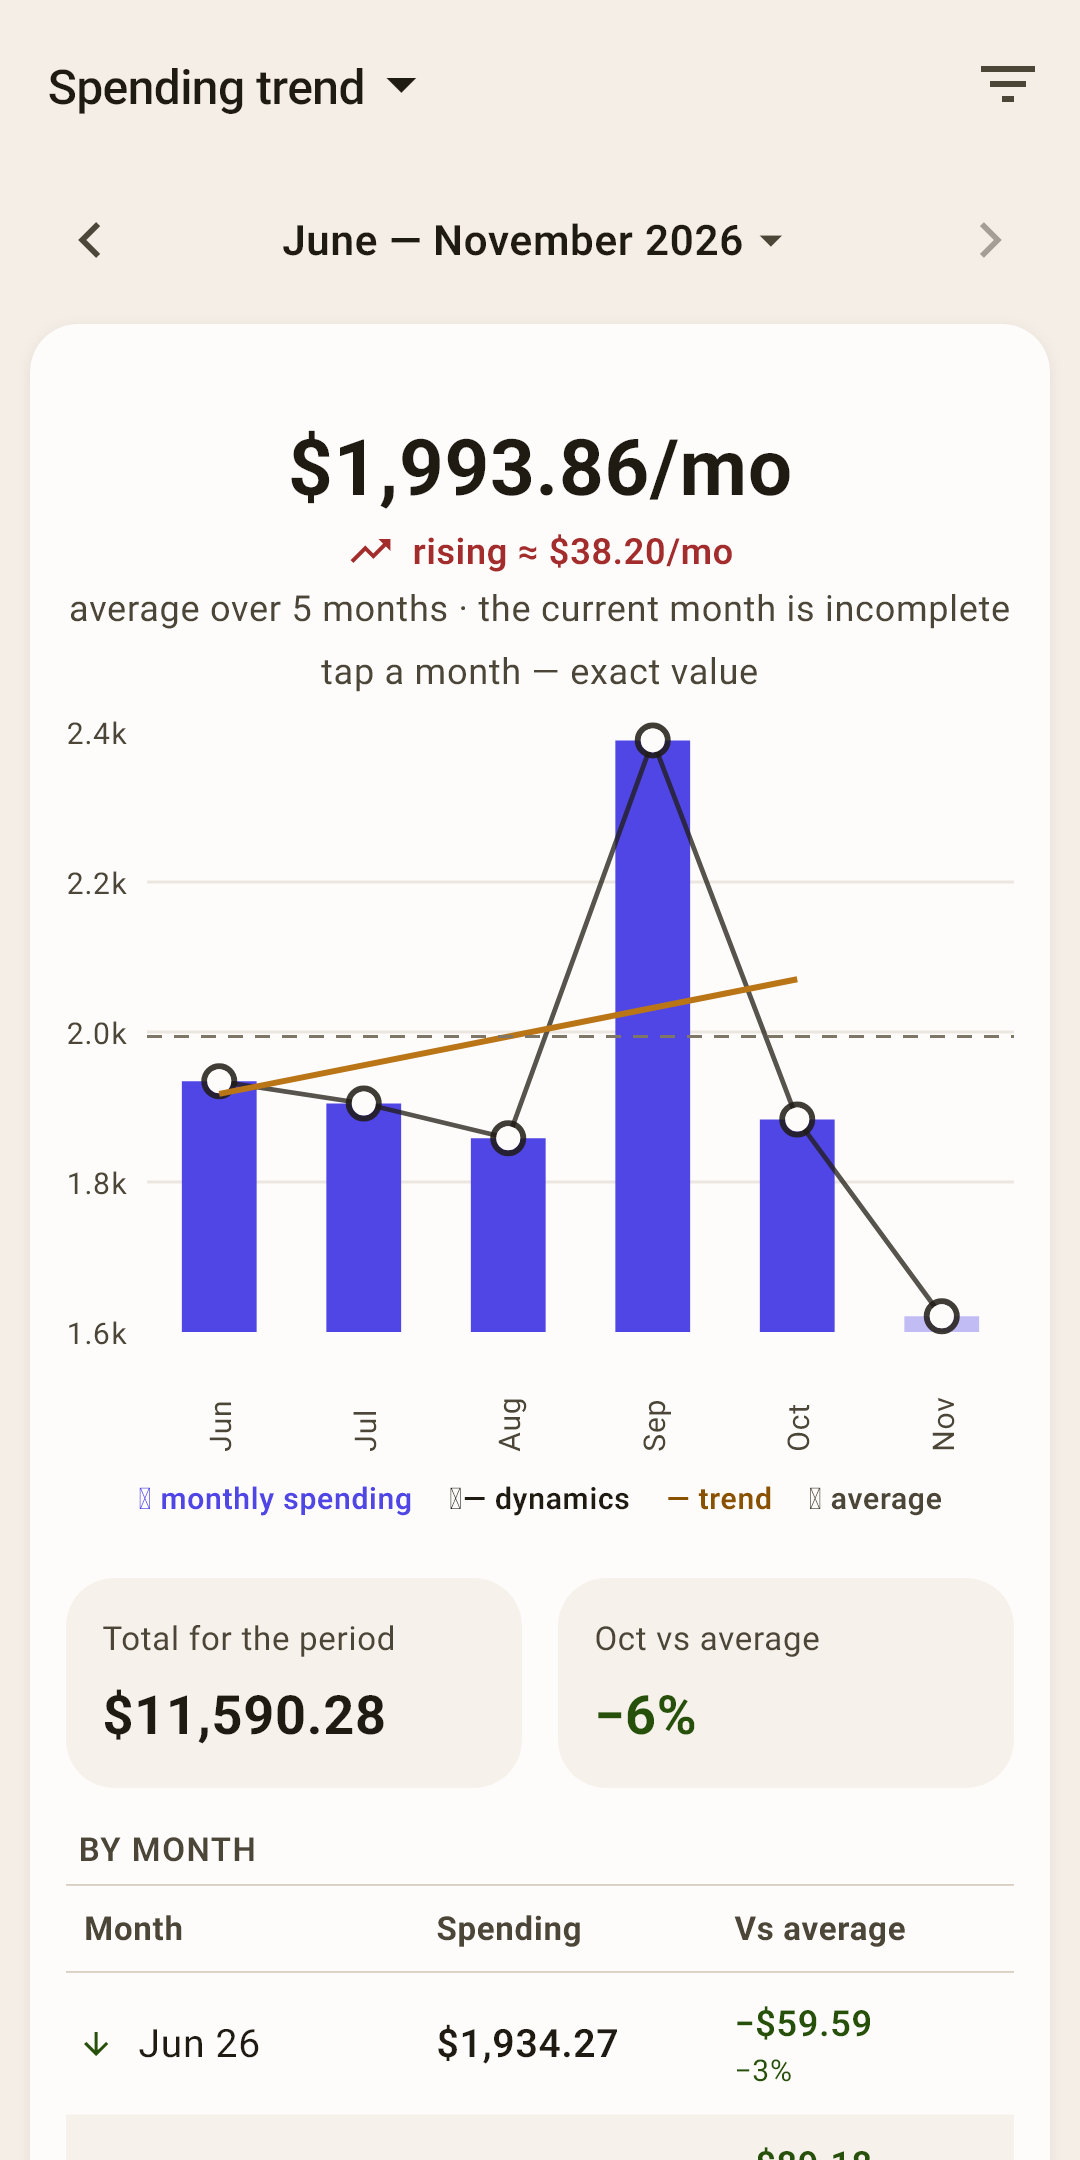
Is your spending rising or falling — by month, with the average and a trend line.
At the top
Average spending per month and where it's heading: “rising ≈ $38.20/mo” or “falling”.
The chart
Bars are each month's spending. The line with dots is the change, the straight line is the trend, the dashed line is the average. The current month is faded: it isn't over yet, so it's left out of the average and the trend.
The “By month” table
Each month and how far it is from the average — in dollars and percent. Tap a month on the chart, and the exact amount appears above it.
Example: are utilities getting more expensive
The overall trend won't tell you: it has all spending at once, and growth in one category gets lost in the rest. Leave just one category in the report.
 Open the screenshot full size ↗
 Open the screenshot full size ↗
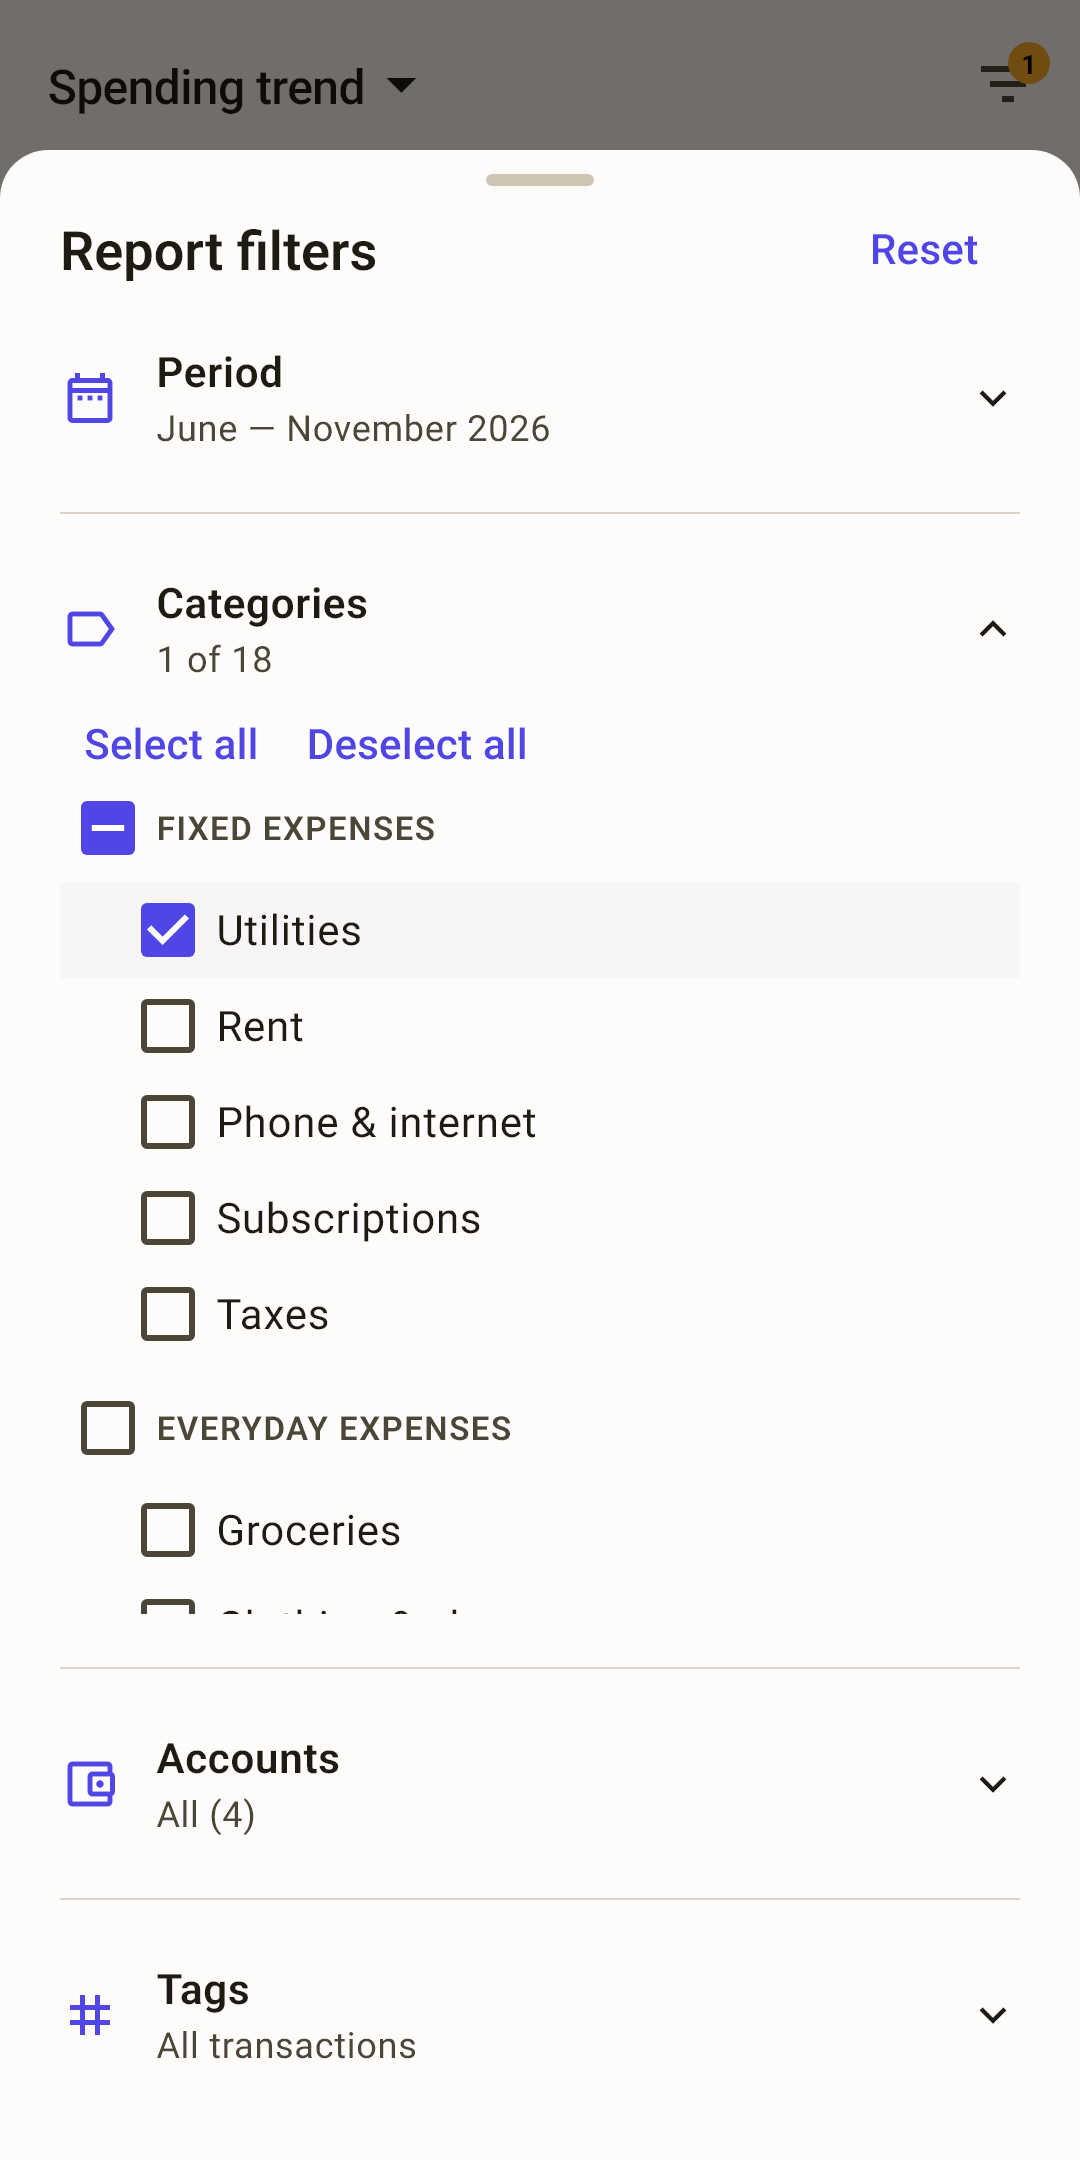
“Categories” — in “Spending trend”, tap the funnel at the top right, then “Categories”: a list of all categories with check boxes opens.
“Deselect all” — unchecks every category at once instead of one by one.
The category you need — check “Utilities”. Under “Categories” it now says “1 of 18”. Close the sheet: swipe it down or tap outside it.
The number on the funnel — how many filters are on. While it's lit, the report doesn't show all spending.
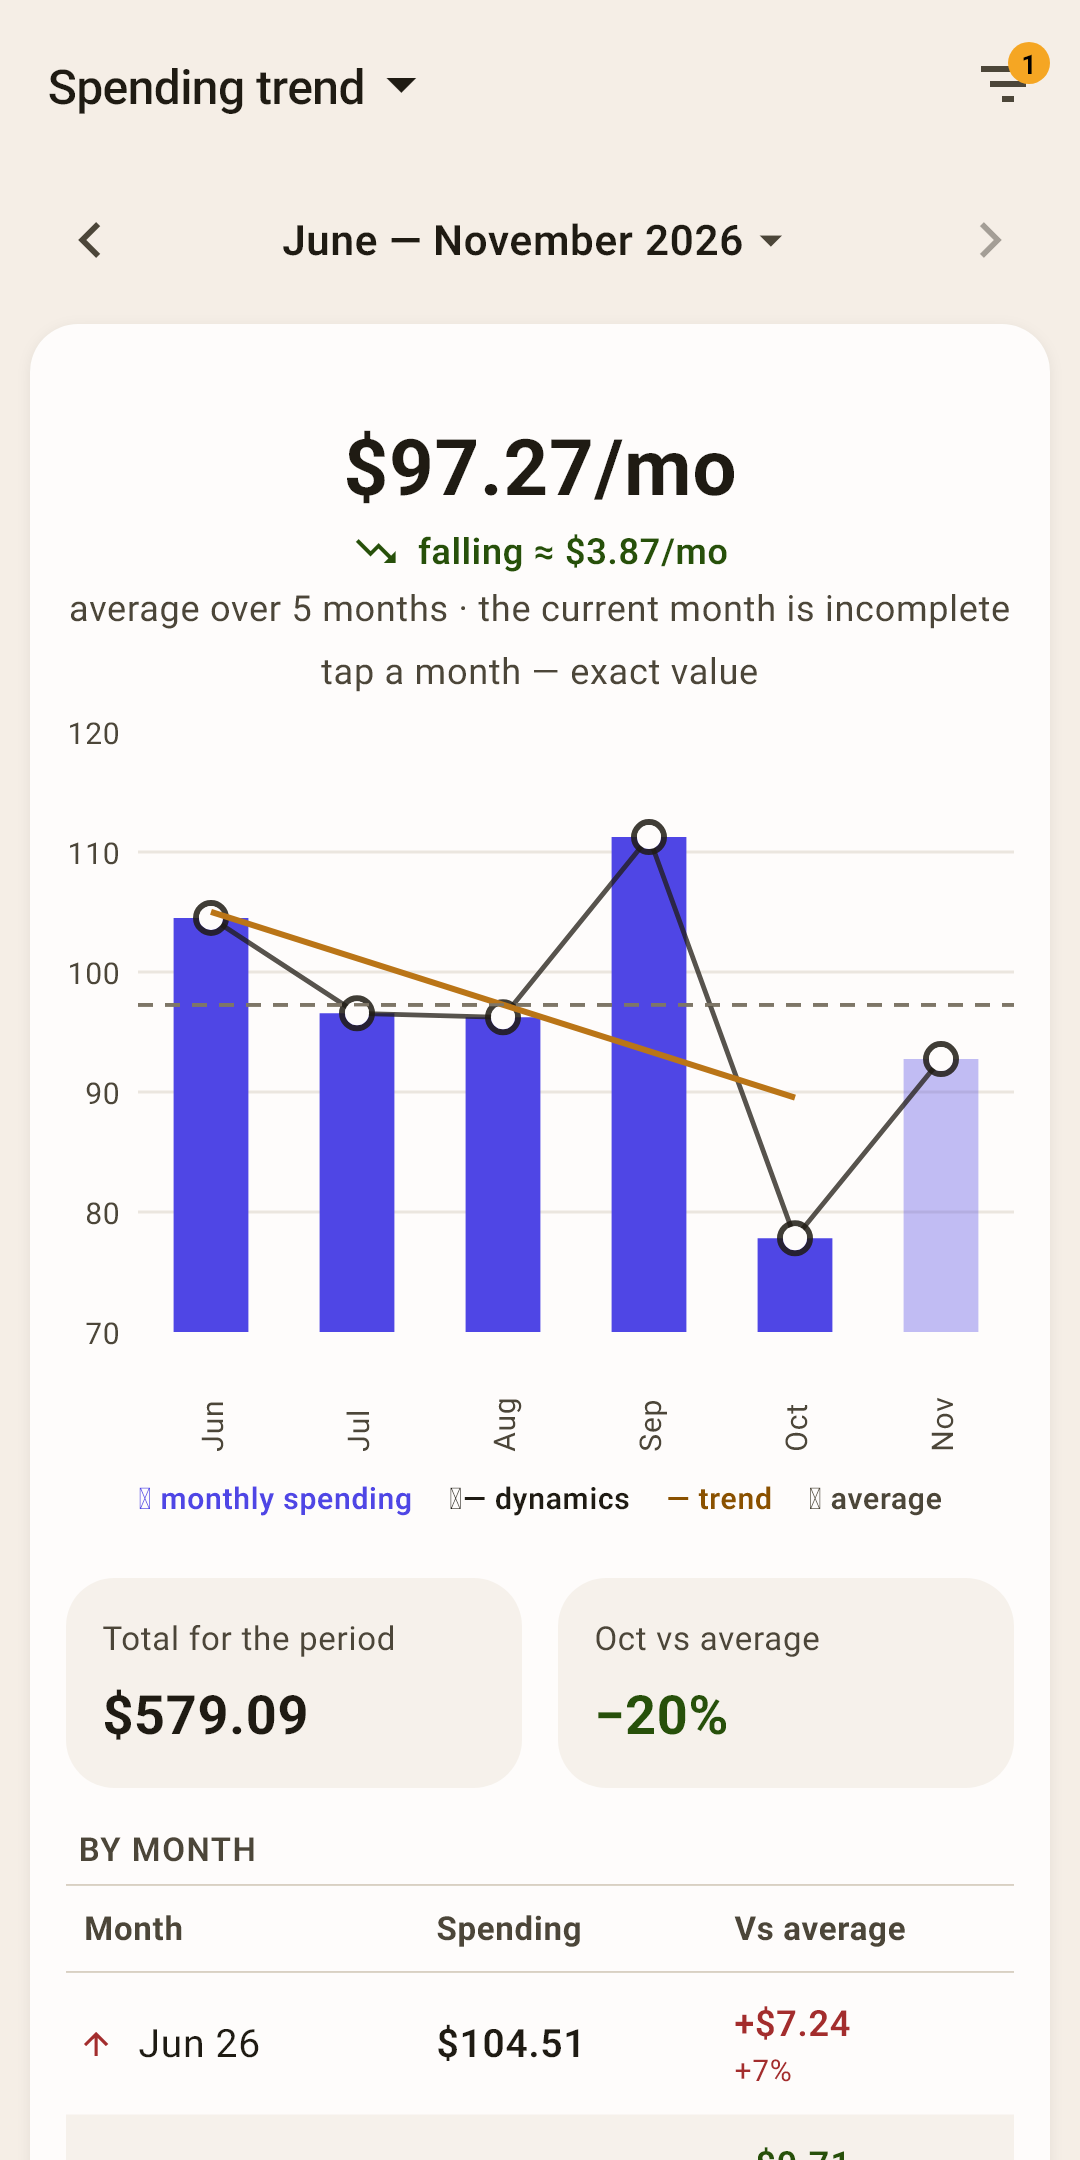
Now the report is about utilities alone: $97.27 a month on average, the bills are falling by about $3.87 a month, and October was 20% cheaper than average. The filter is remembered for this report: next time “Spending trend” opens with it. To bring back all categories — “Select all” or “Reset” in the filters sheet.
Top payees
The same as “Where the money went”, but by payee: who you pay the most.
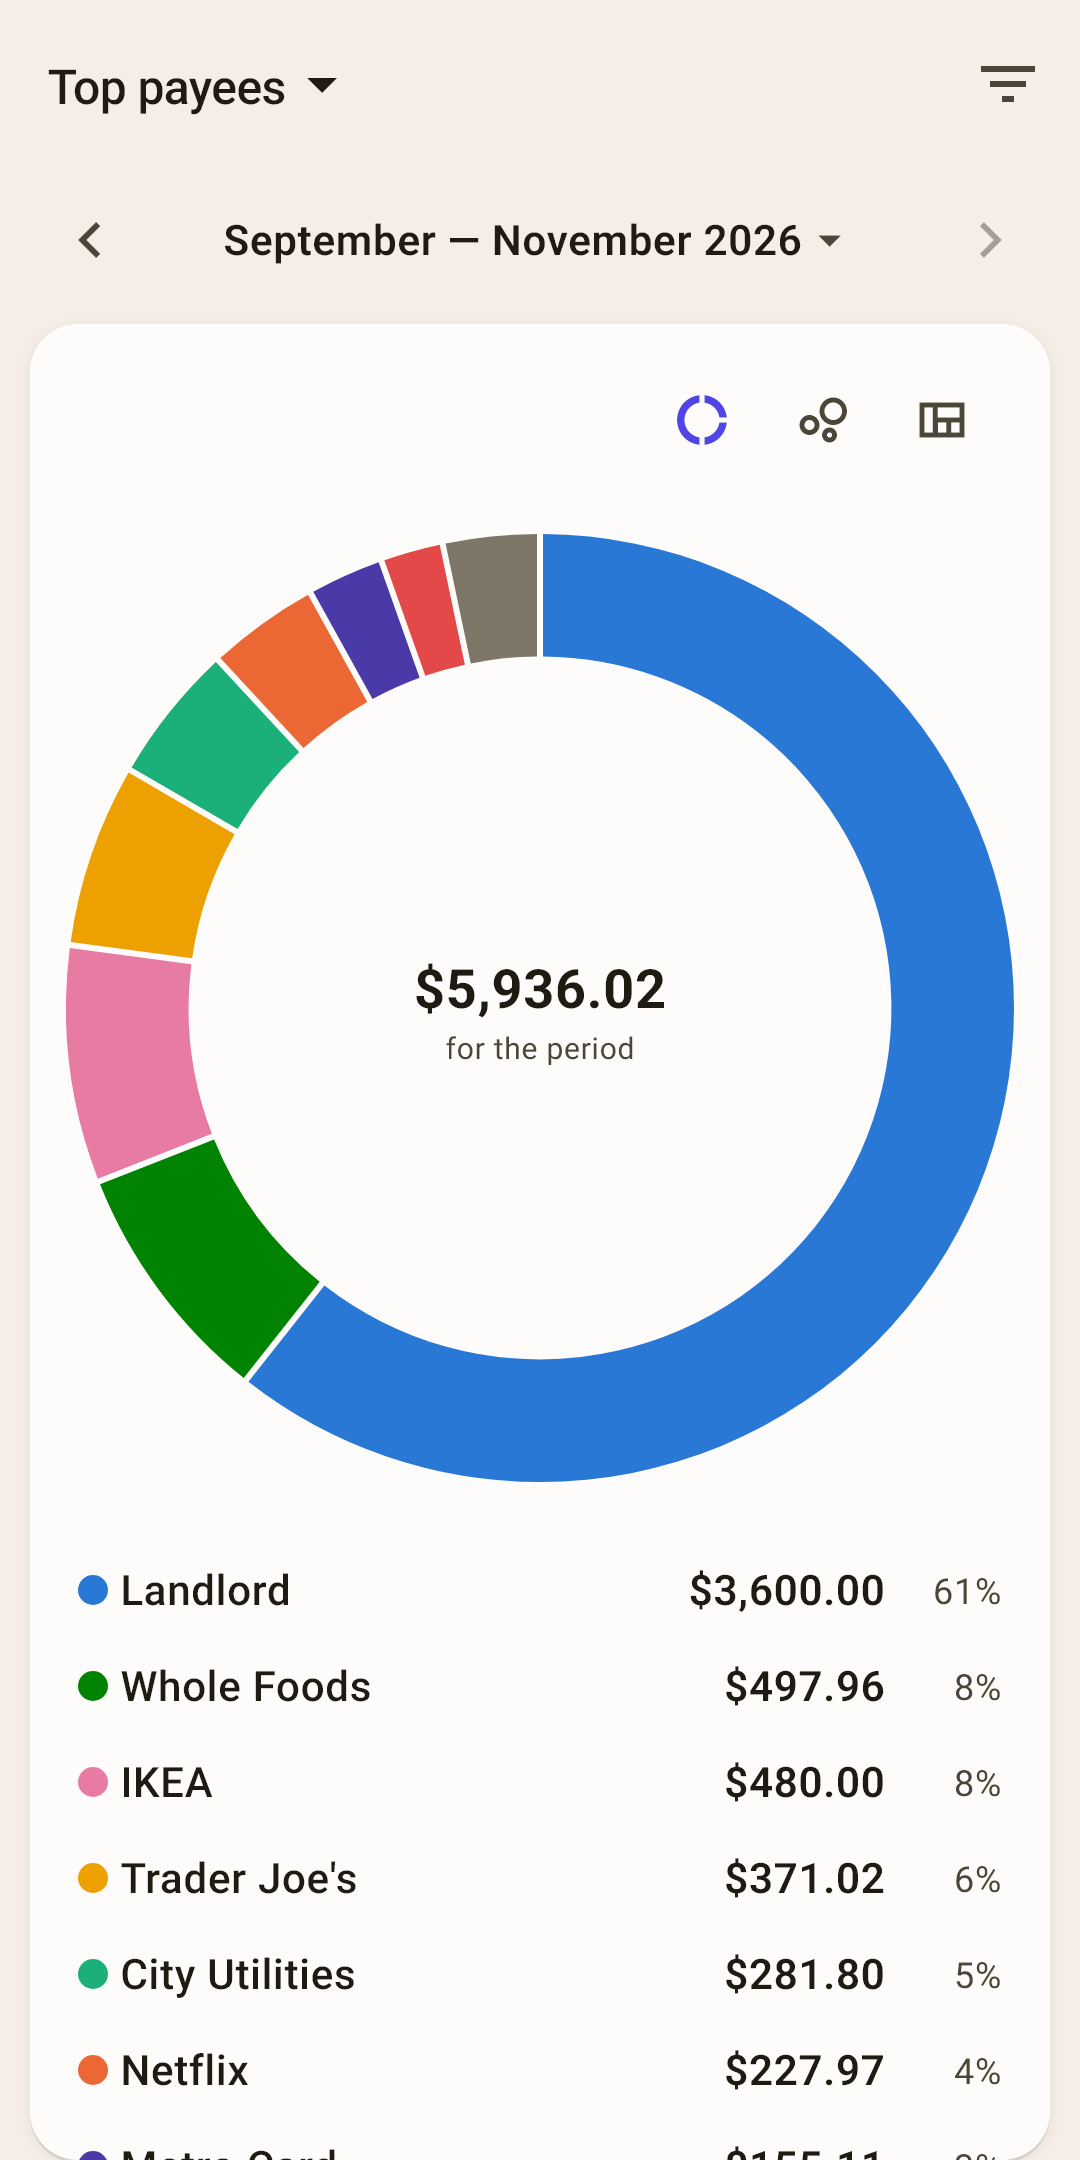
The same three views
Donut, bubbles or tiles — this report keeps its own choice.
Tapping
A row or a slice opens the payee screen: all spending with them, by category and by month (article “Payees and tags”).
Deviation
Where you're spending more or less than usual this month — at a glance. It compares with your 12 months before the period: the month in progress is compared with the same days of past months, from the 1st to today's date, and a period of several months with a usual month multiplied by their number.
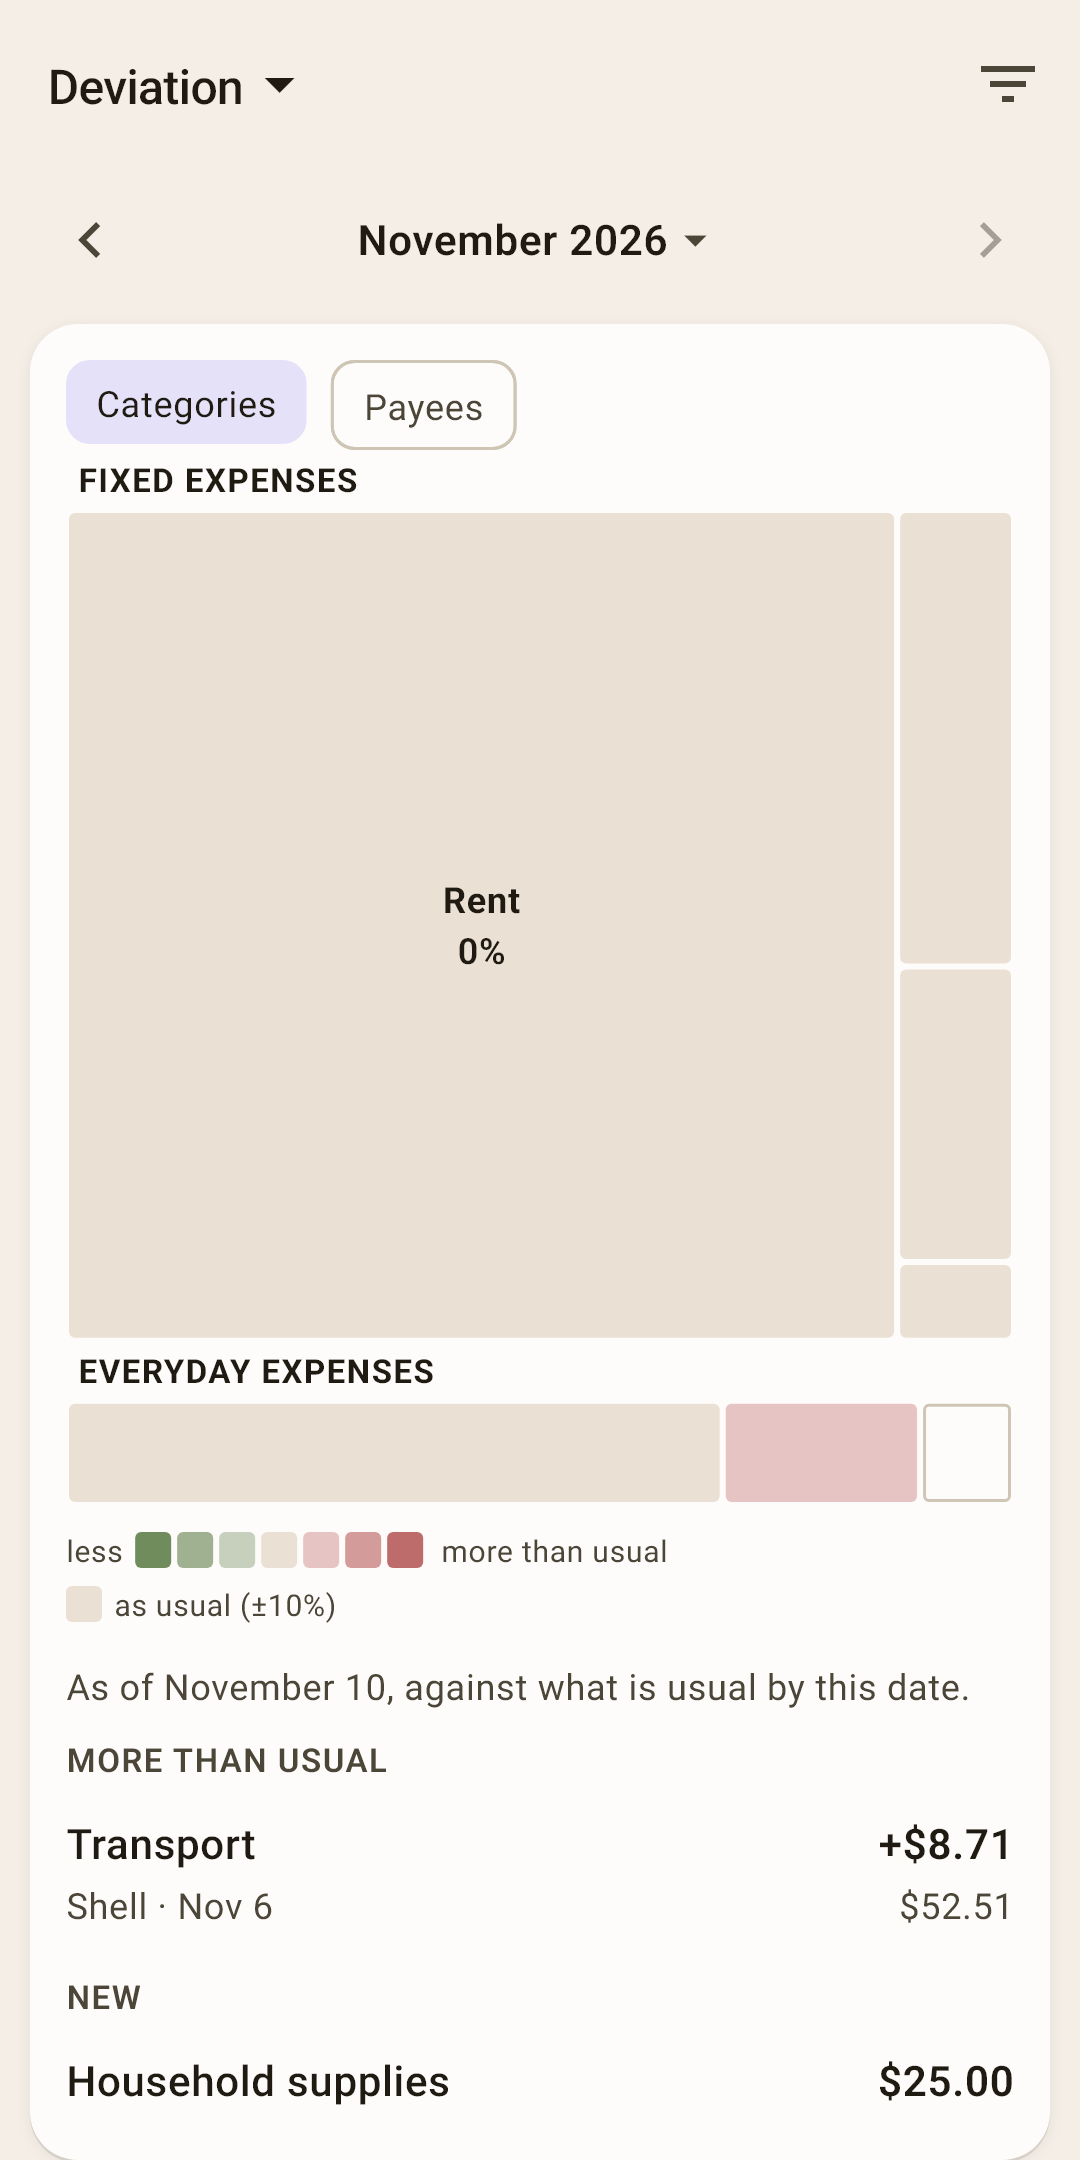
Tiles
A tile's size is how much was spent, its color is how much more (reddish) or less (greenish) than usual, in three steps. Gray ones are as usual, within 10%. An outline without fill means the category appeared for the first time.
“Usually”
The middle of your past months over the year: one unusually expensive month won't shift it. For the current month — “usually by this date”: November 10 is compared with the same days of past months.
The summary in words
Under the tiles — “More than usual”, “Less”, “New” with amounts. “Categories” or “Payees” — chips at the top.
Tags
How much went under each tag — by month, as a table or a chart.
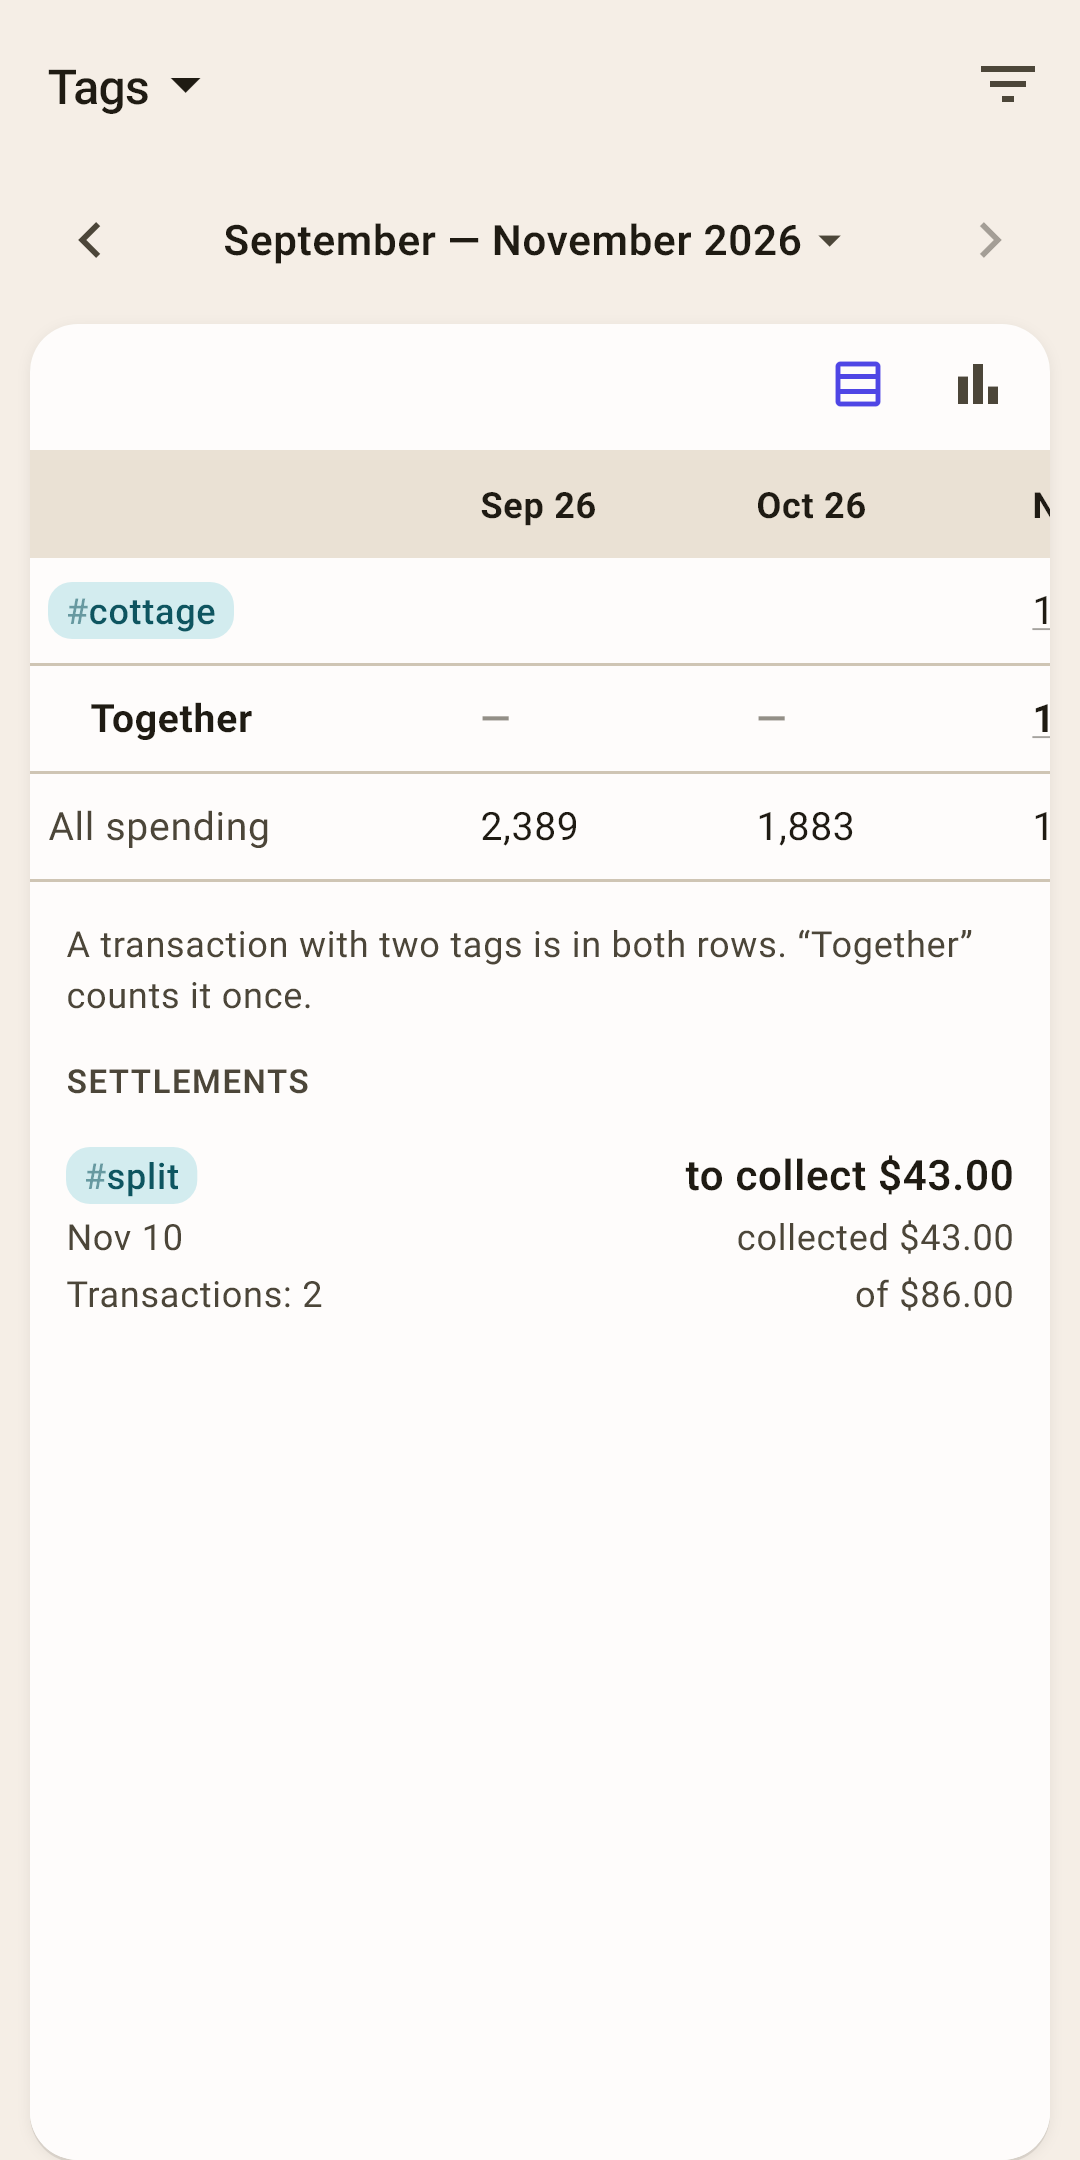
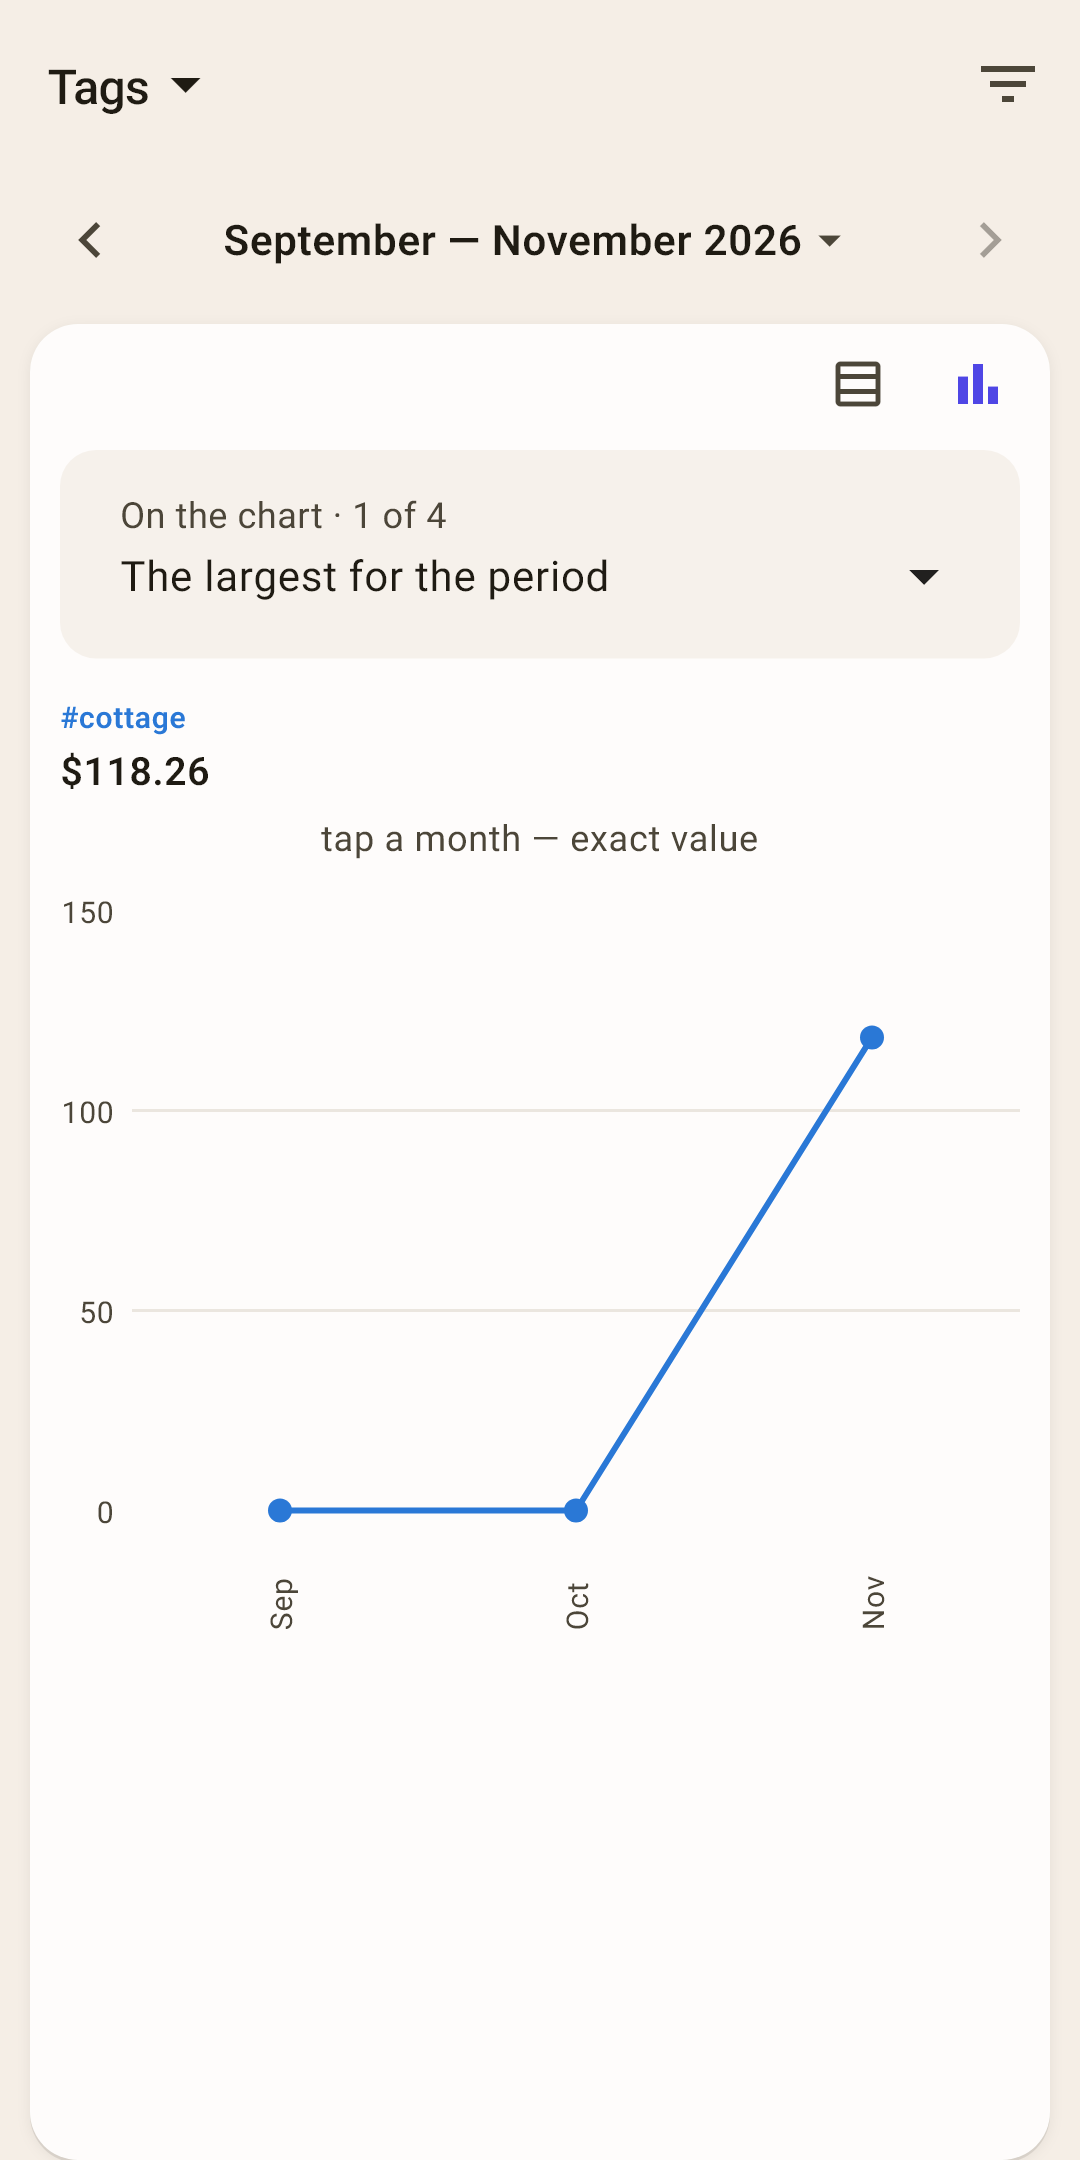
The table
A row per tag, a column per month. “Together” is all tags at once: a transaction with two tags counts in it once. “All spending” is there for comparison.
“Settlements”
Tags with “Settle up” turned on, as a separate block: how much to collect or to return.
The chart
Up to four tags as lines by month; which ones — you choose above the chart.
Money flow
Where the money came from, where it went, and how much is left.
Money flow
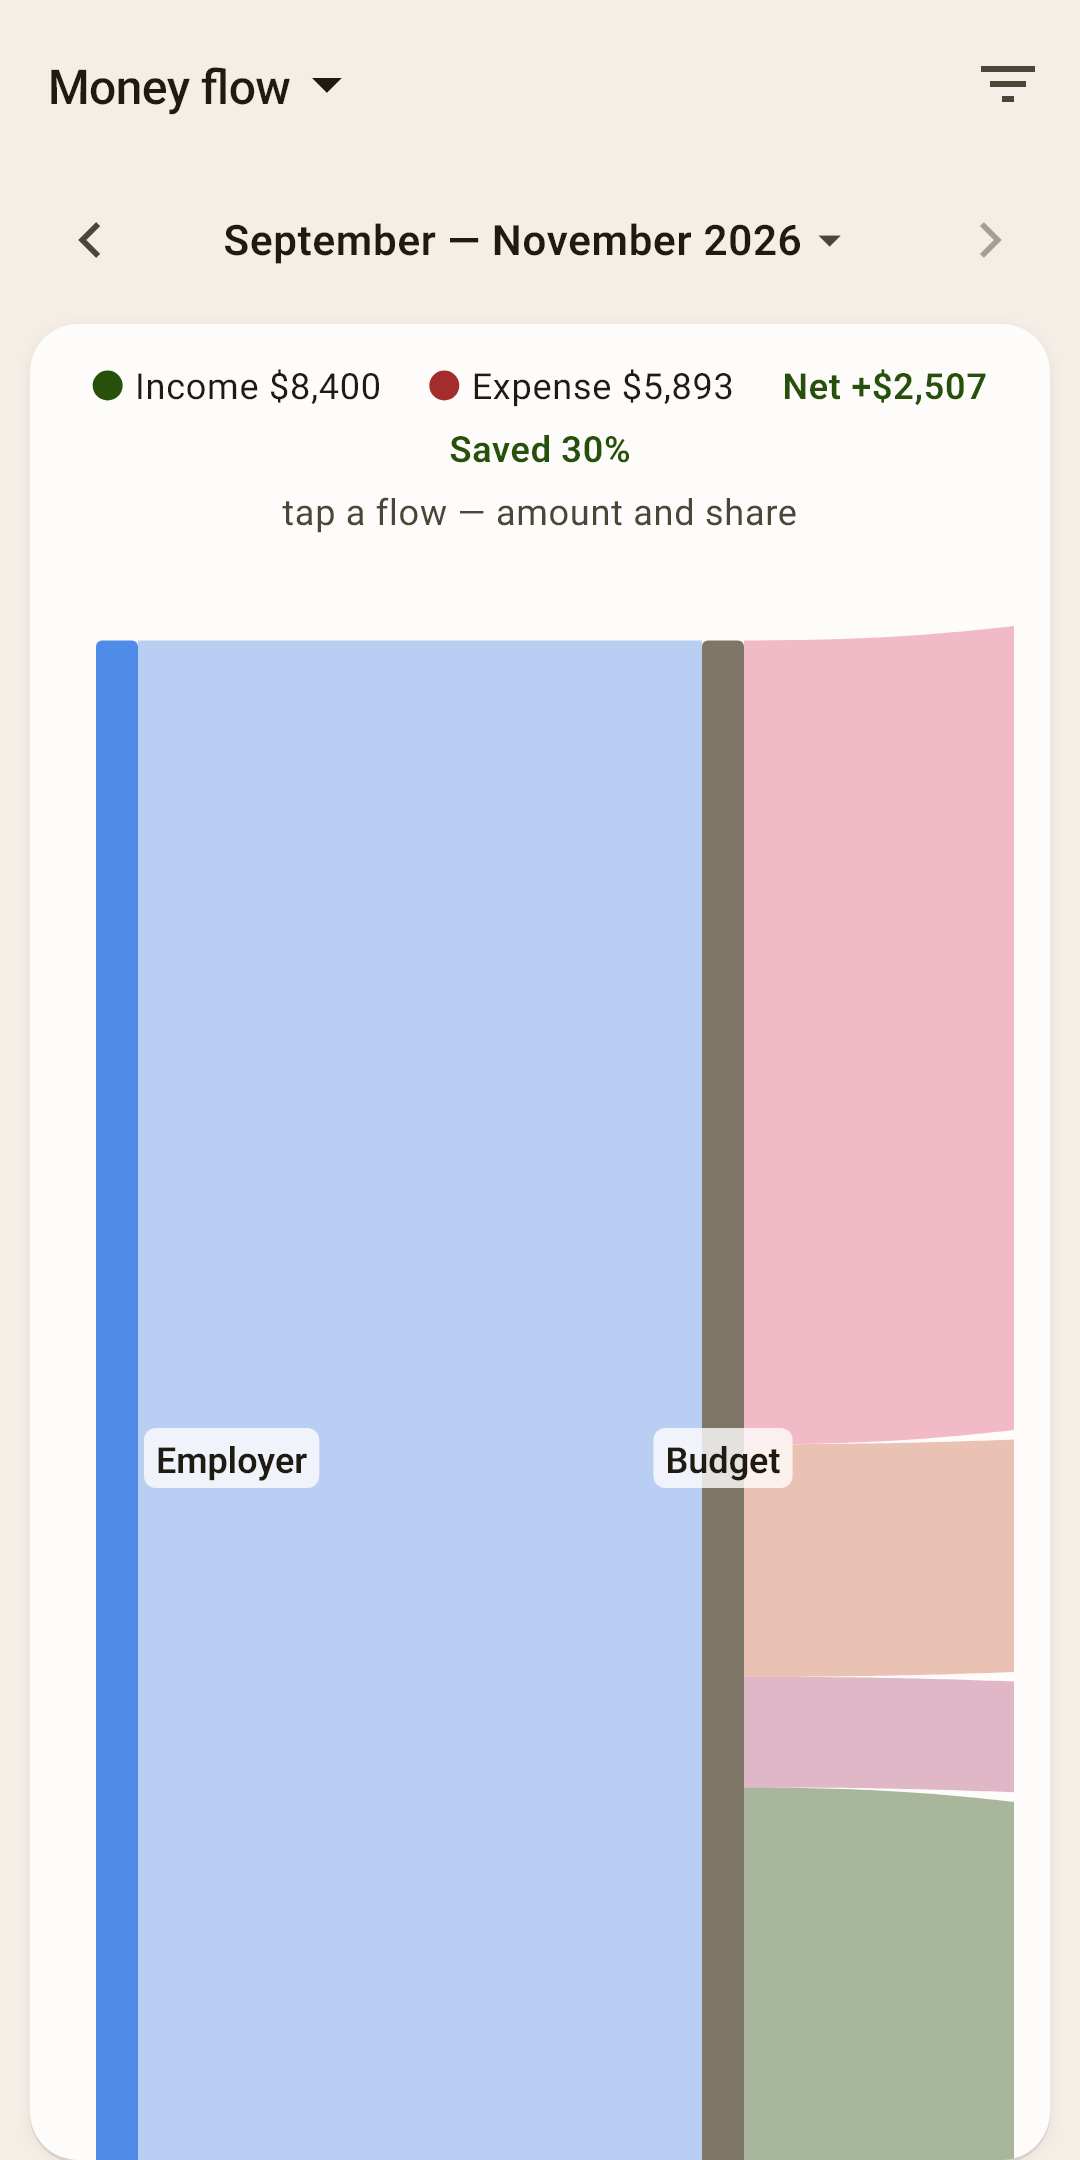
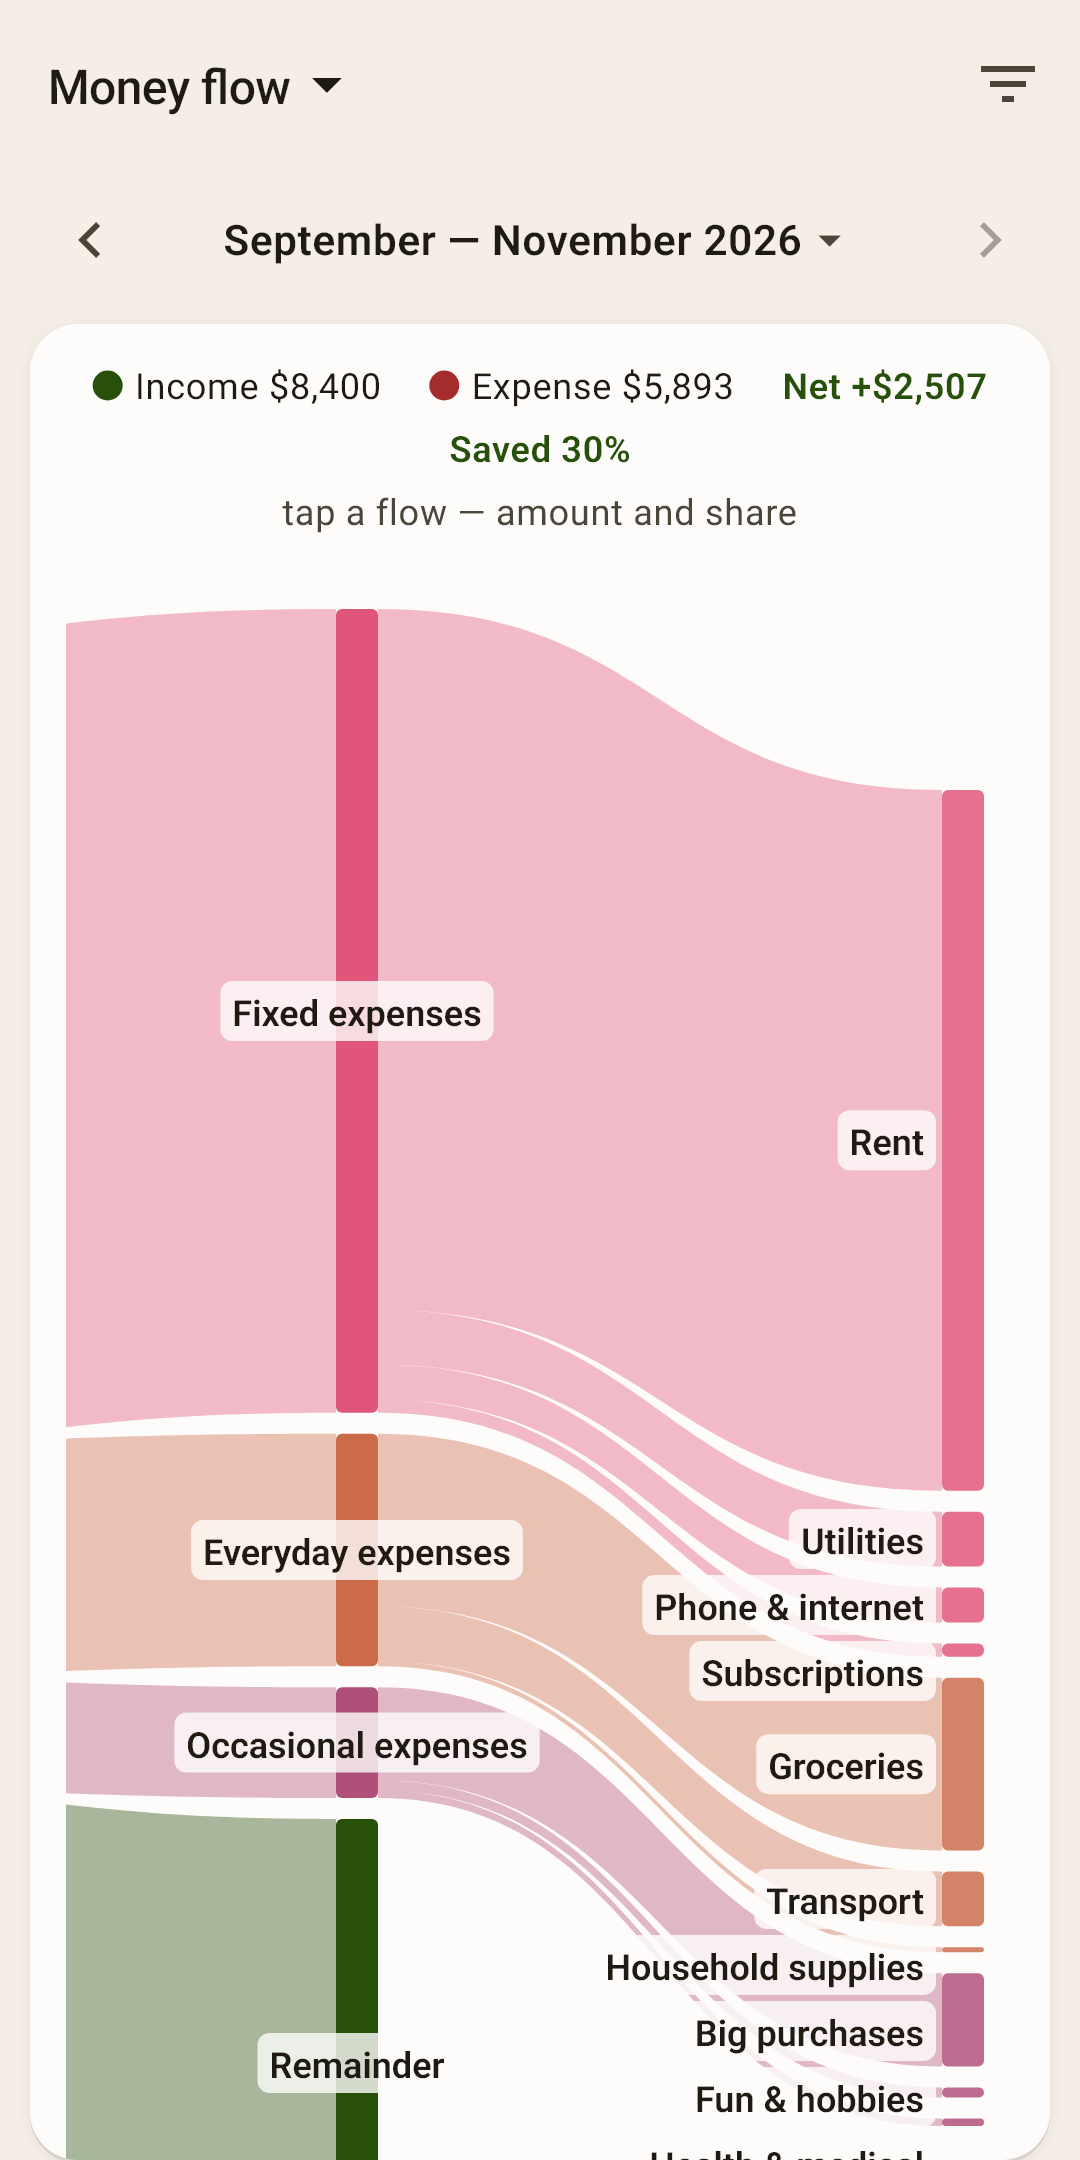
The money's whole journey in one picture: from income sources — into the budget — by group — by category.
 Open the screenshot full size ↗
 Open the screenshot full size ↗
At the top
Income, expenses, “net” (how much is left) and the savings rate — what percent of income wasn't spent.
Ribbons
A ribbon's thickness is the amount. Tap a ribbon to see the amount and percent. The green “Remainder” band is money that didn't go anywhere.
How to look at it
The picture is wider than the screen: swipe sideways and down. The header with the totals scrolls along with the picture.
Income and expenses
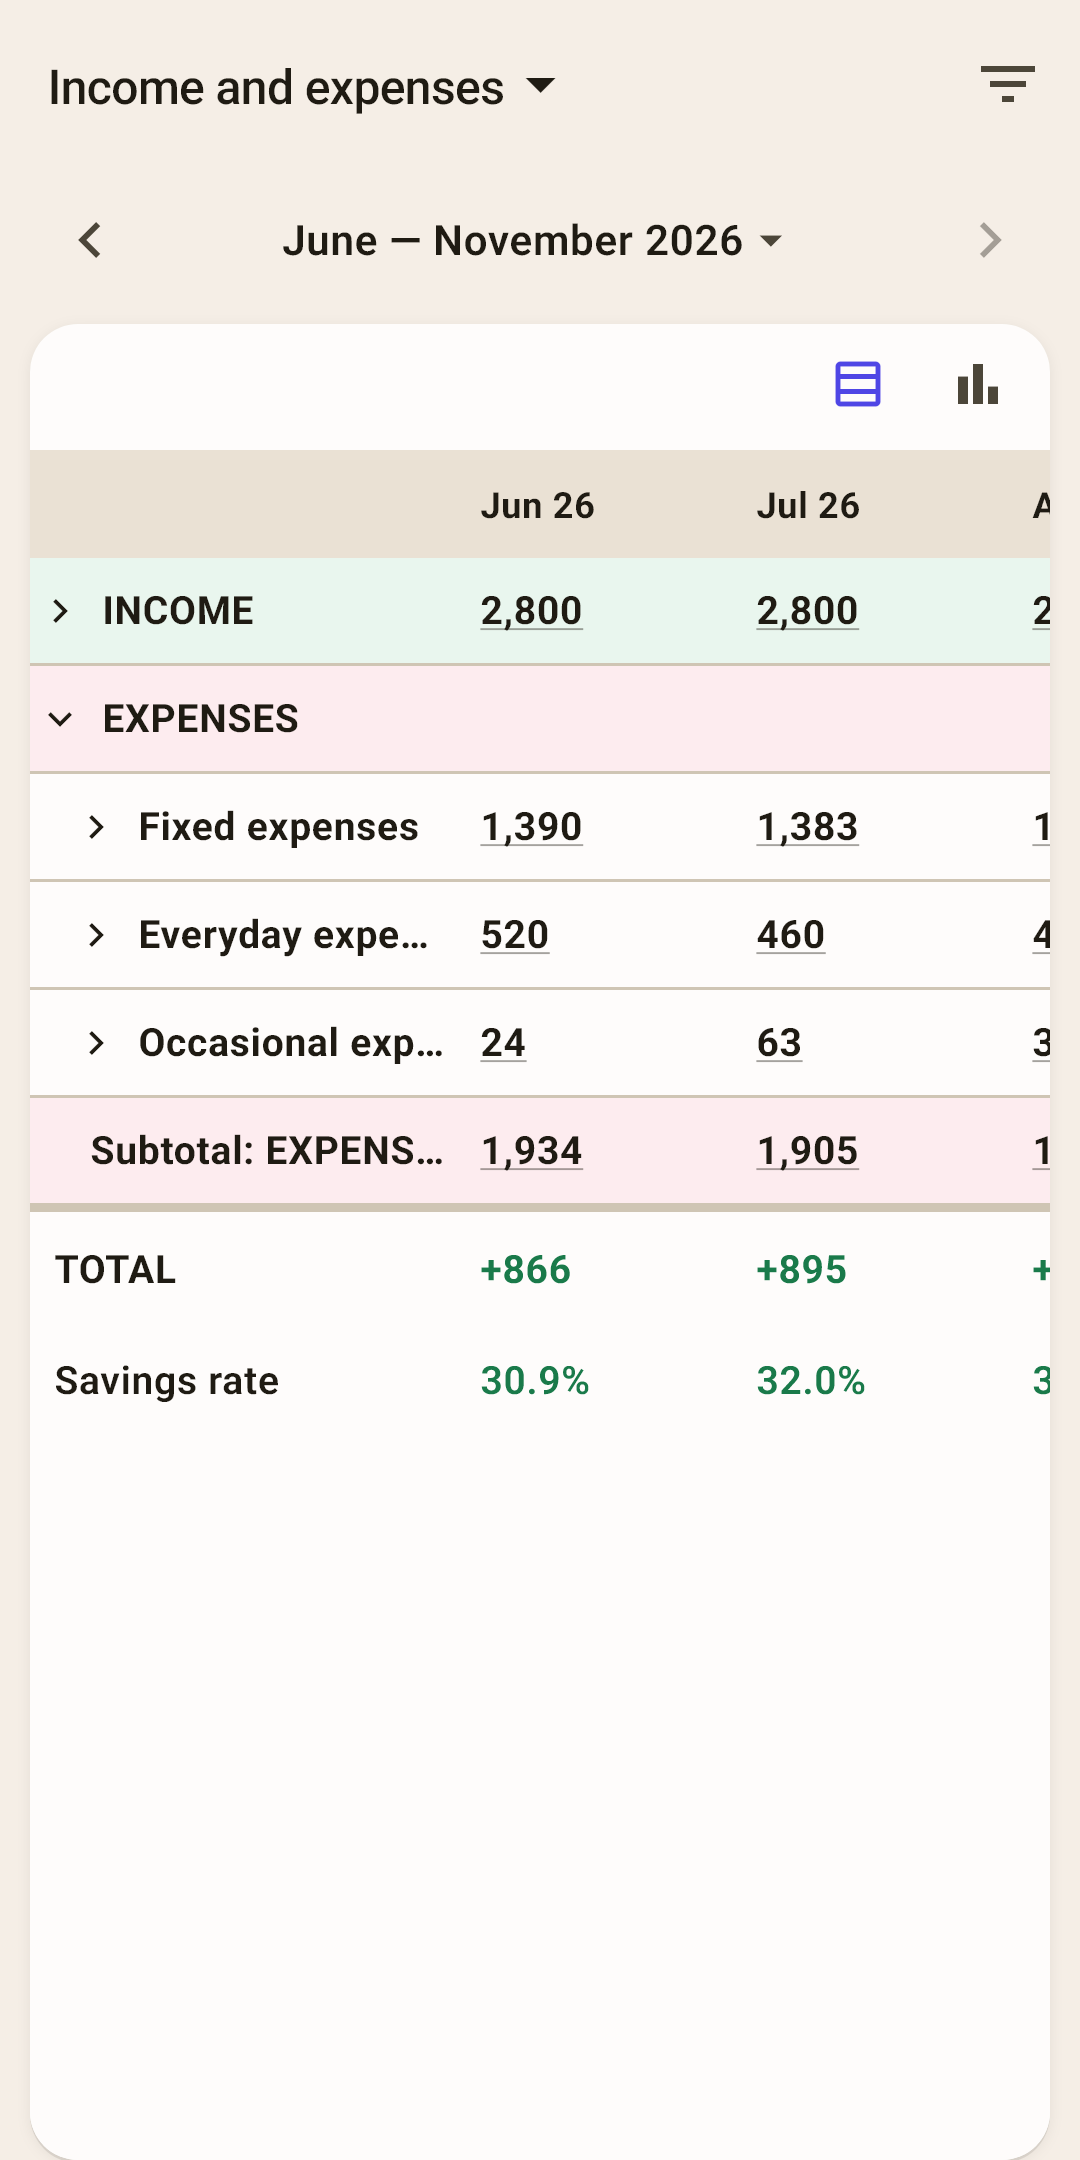
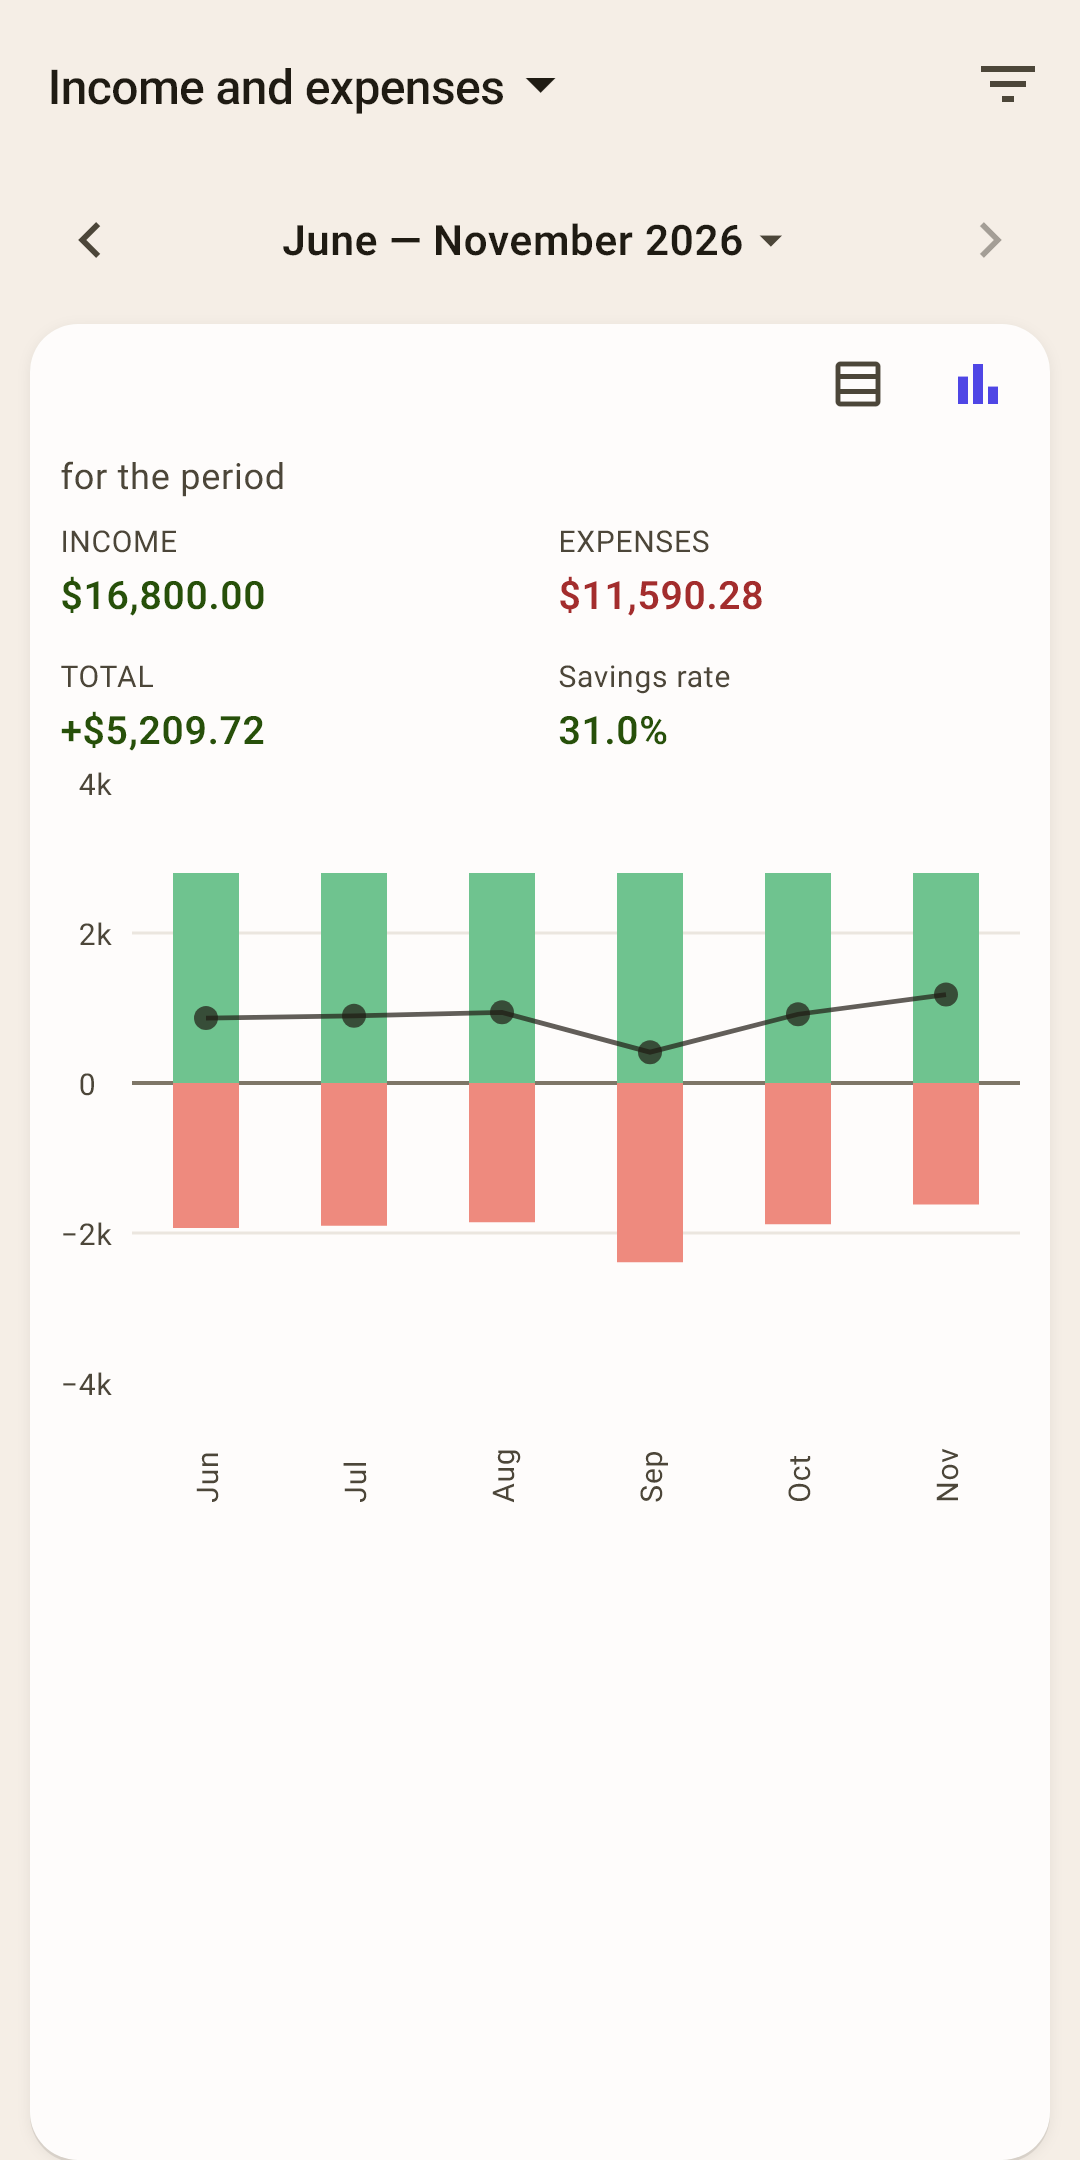
Month-by-month bookkeeping: how much came in, how much went out by group, what's left.
The table
Rows are income by source and expenses by group; a group can be expanded down to categories. At the bottom — each month's “Total” and “Savings rate”.
How it works
Tap a number to open the list of transactions it's made of. The table is wider than the screen — swipe sideways.
The chart
Each month has two bars: green going up — how much money came in, red going down — how much went out. A thin line shows what's left: above zero, the month ended in the plus; below, you spent more than came in. Above the chart are four numbers for the whole period: income, expenses, total and savings rate. Tap a month, and the numbers show just that month; slide your finger, and they change across the neighboring months; tap the same month again, and it's the whole period again.
Age of money
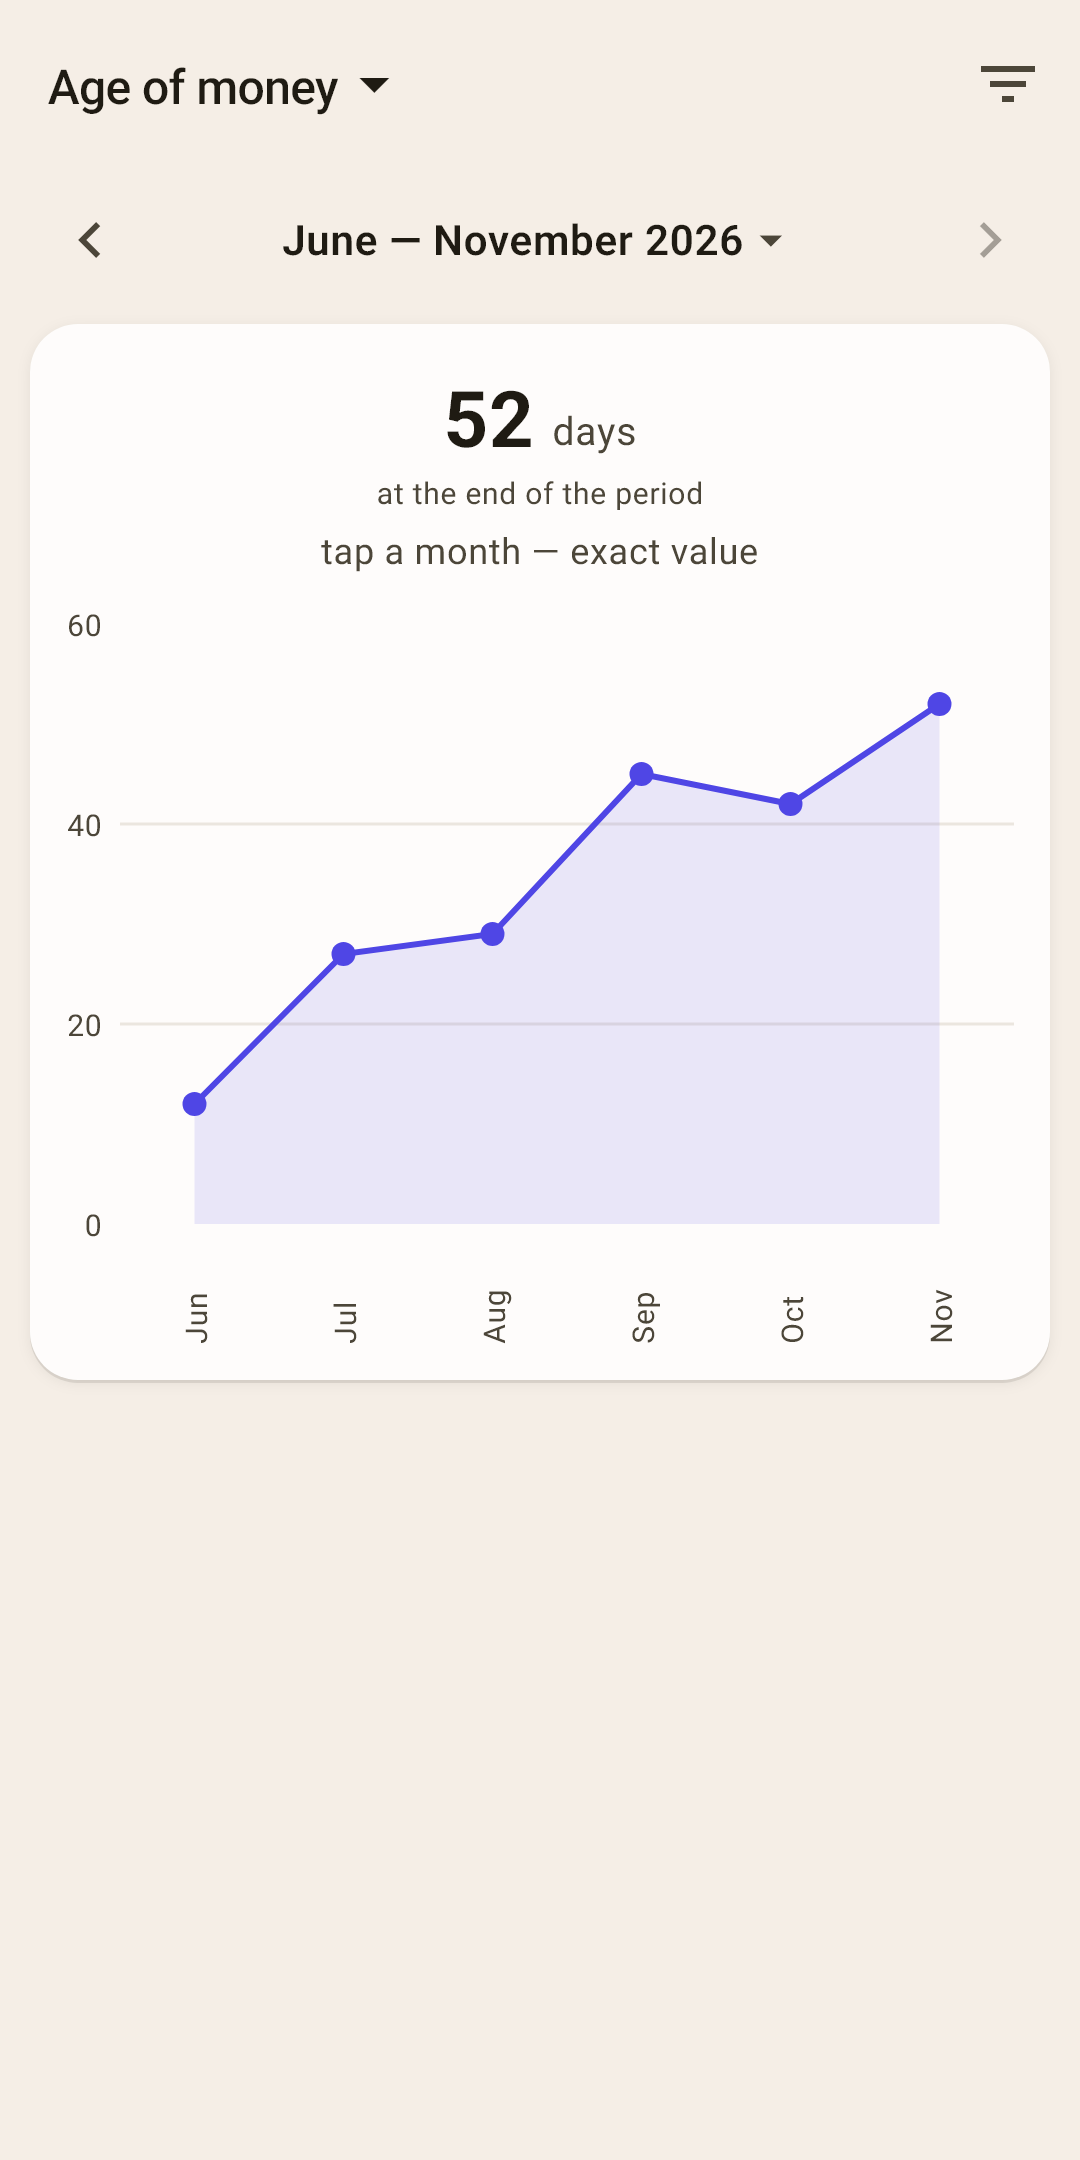
How your age of money changed month by month.
The number at the top
The age at the end of the period — the same number as on “Overview”.
Why
You see whether your buffer is growing. A line going up means you're further and further from “paycheck to paycheck”. What the number means and how it's calculated — in the article “Overview”, section “Age of money in detail”.
Net worth
Everything you own and everything you owe.
Net worth
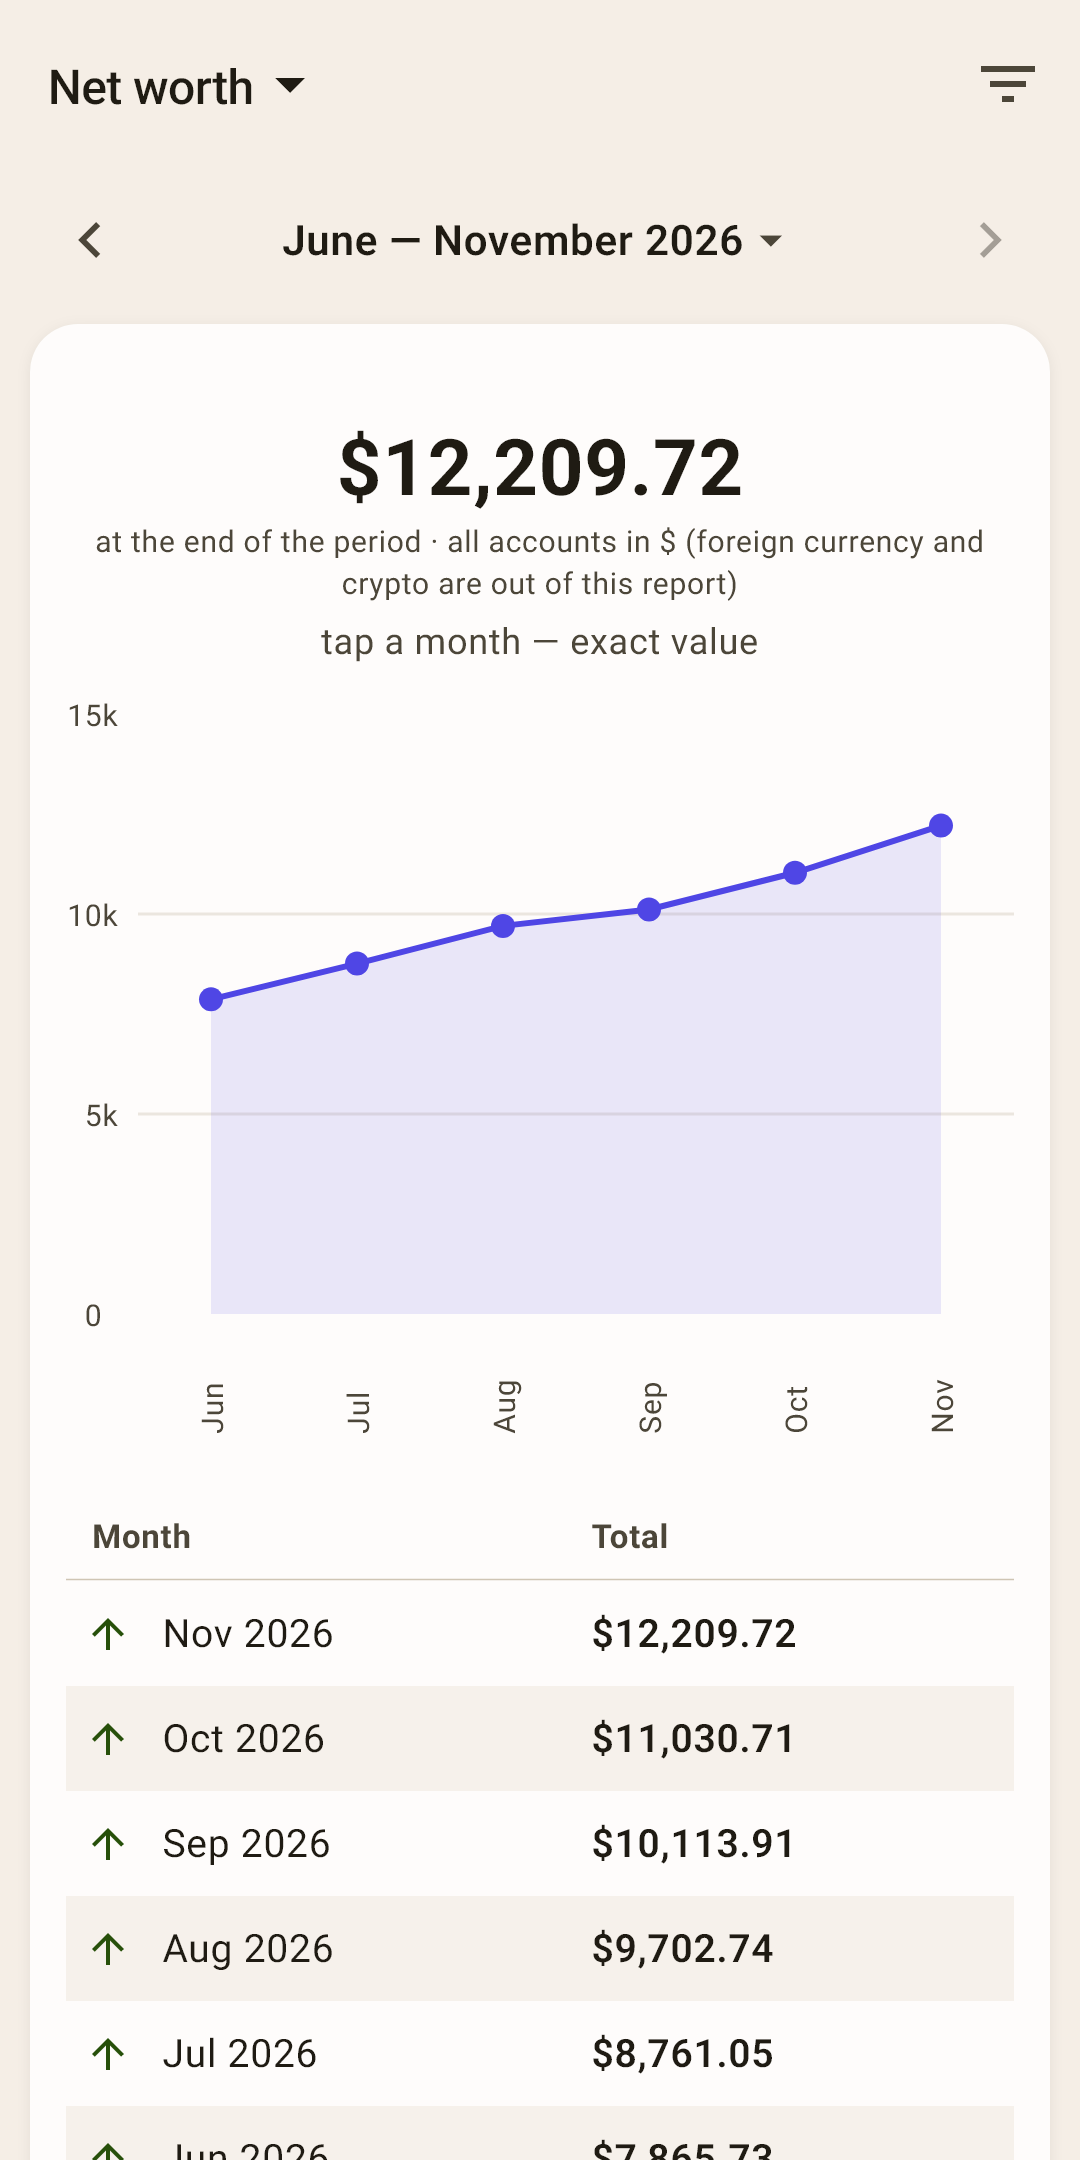
The total of all accounts minus debts — and how it changed.
What's included
All accounts in the main currency — both on budget and off budget (savings, deposits), minus credit cards and loans. Accounts in other currencies aren't converted and aren't included in the total.
The table
Net worth at the end of each month, with an arrow — up or down.
Card debt
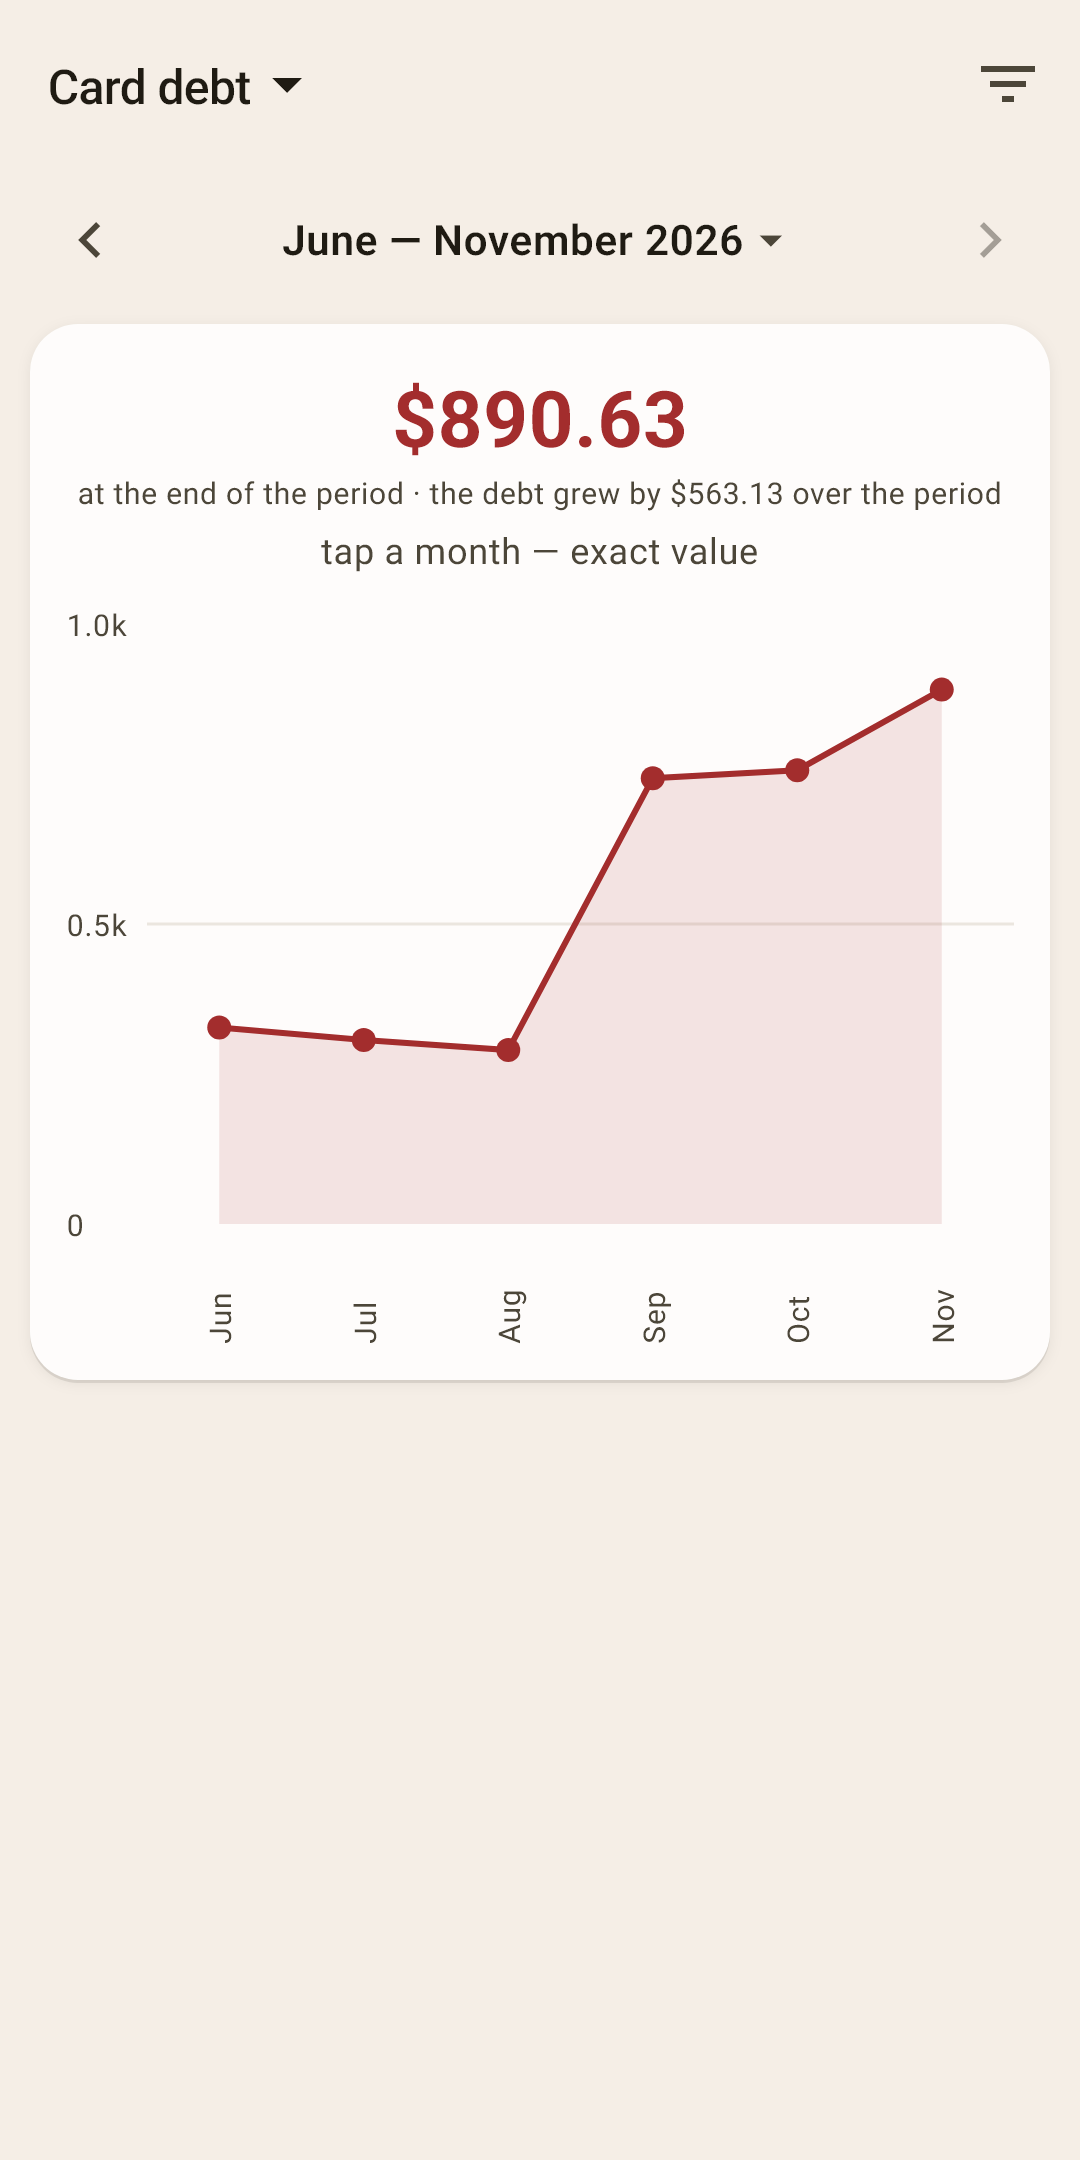
How much you owe on credit cards — and whether the debt is growing.
The number at the top
The debt on all credit cards at the end of the period and how much it grew or shrank over the period.
When you see it
The report is in the list only if you have a credit card. How a credit card works in the budget — in the article “How the budget works”.